
This release brings a round of updates across the dashboard, with most of the changes landing on the Tasks page and the side menu you navigate with.
A calmer side menu
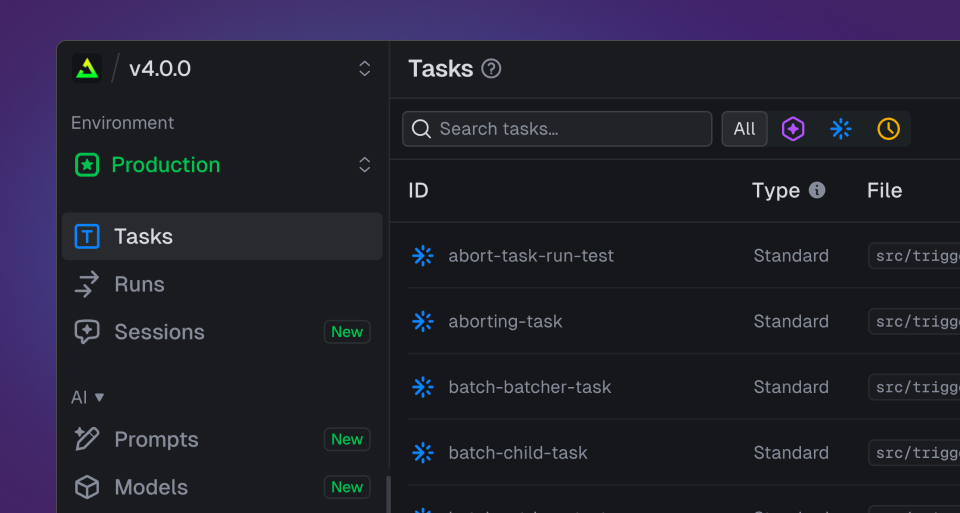
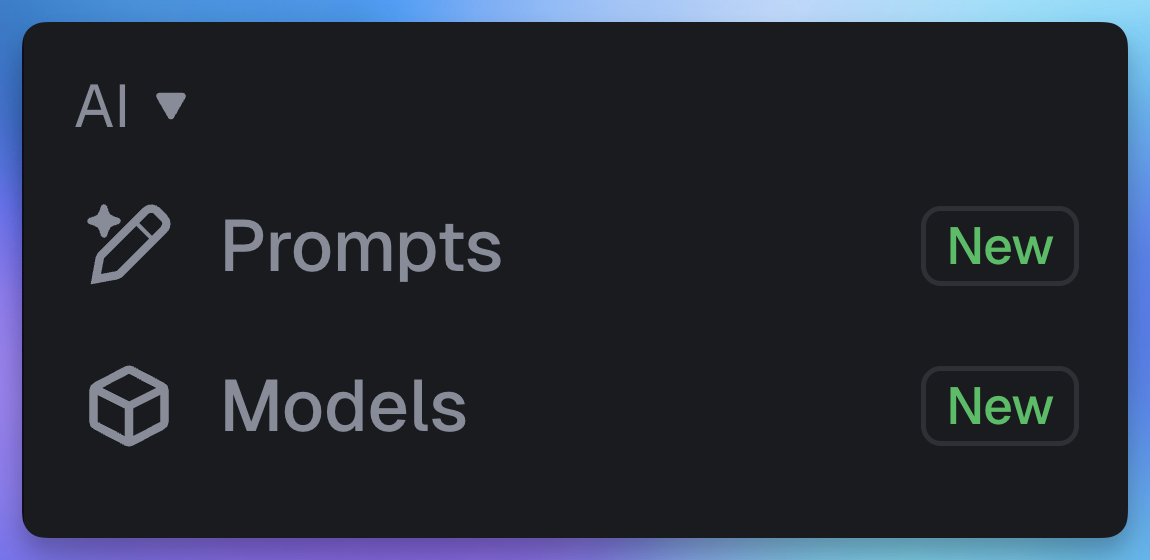
The side menu had grown busy, so we've tidied it up. Every item now has a custom icon, and we've toned down the color so the navigation sits back and your content stands out.
New task icons and filtering by type
We've added a new kind of task: the agent task. To tell the types apart at a glance, every task type now has its own icon: standard, scheduled, and agent. The same icons power a new filter on the Tasks page, so you can narrow the list to just the type you're working with.
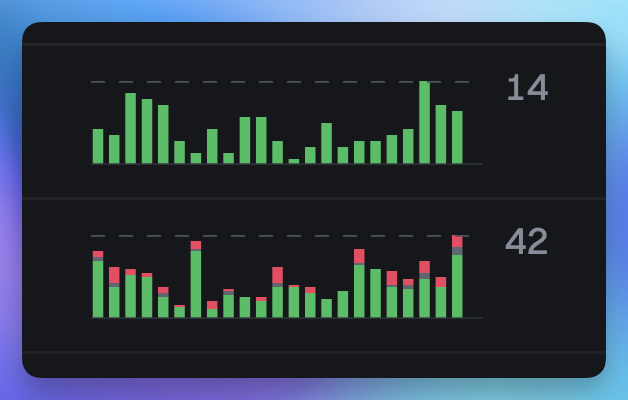
24-hour activity charts
The activity charts on the Tasks page now cover the last 24 hours. The shorter window gives you a more granular read on what's happening right now: which tasks are busy, which just spiked, which have gone quiet.
Every task gets its own overview page
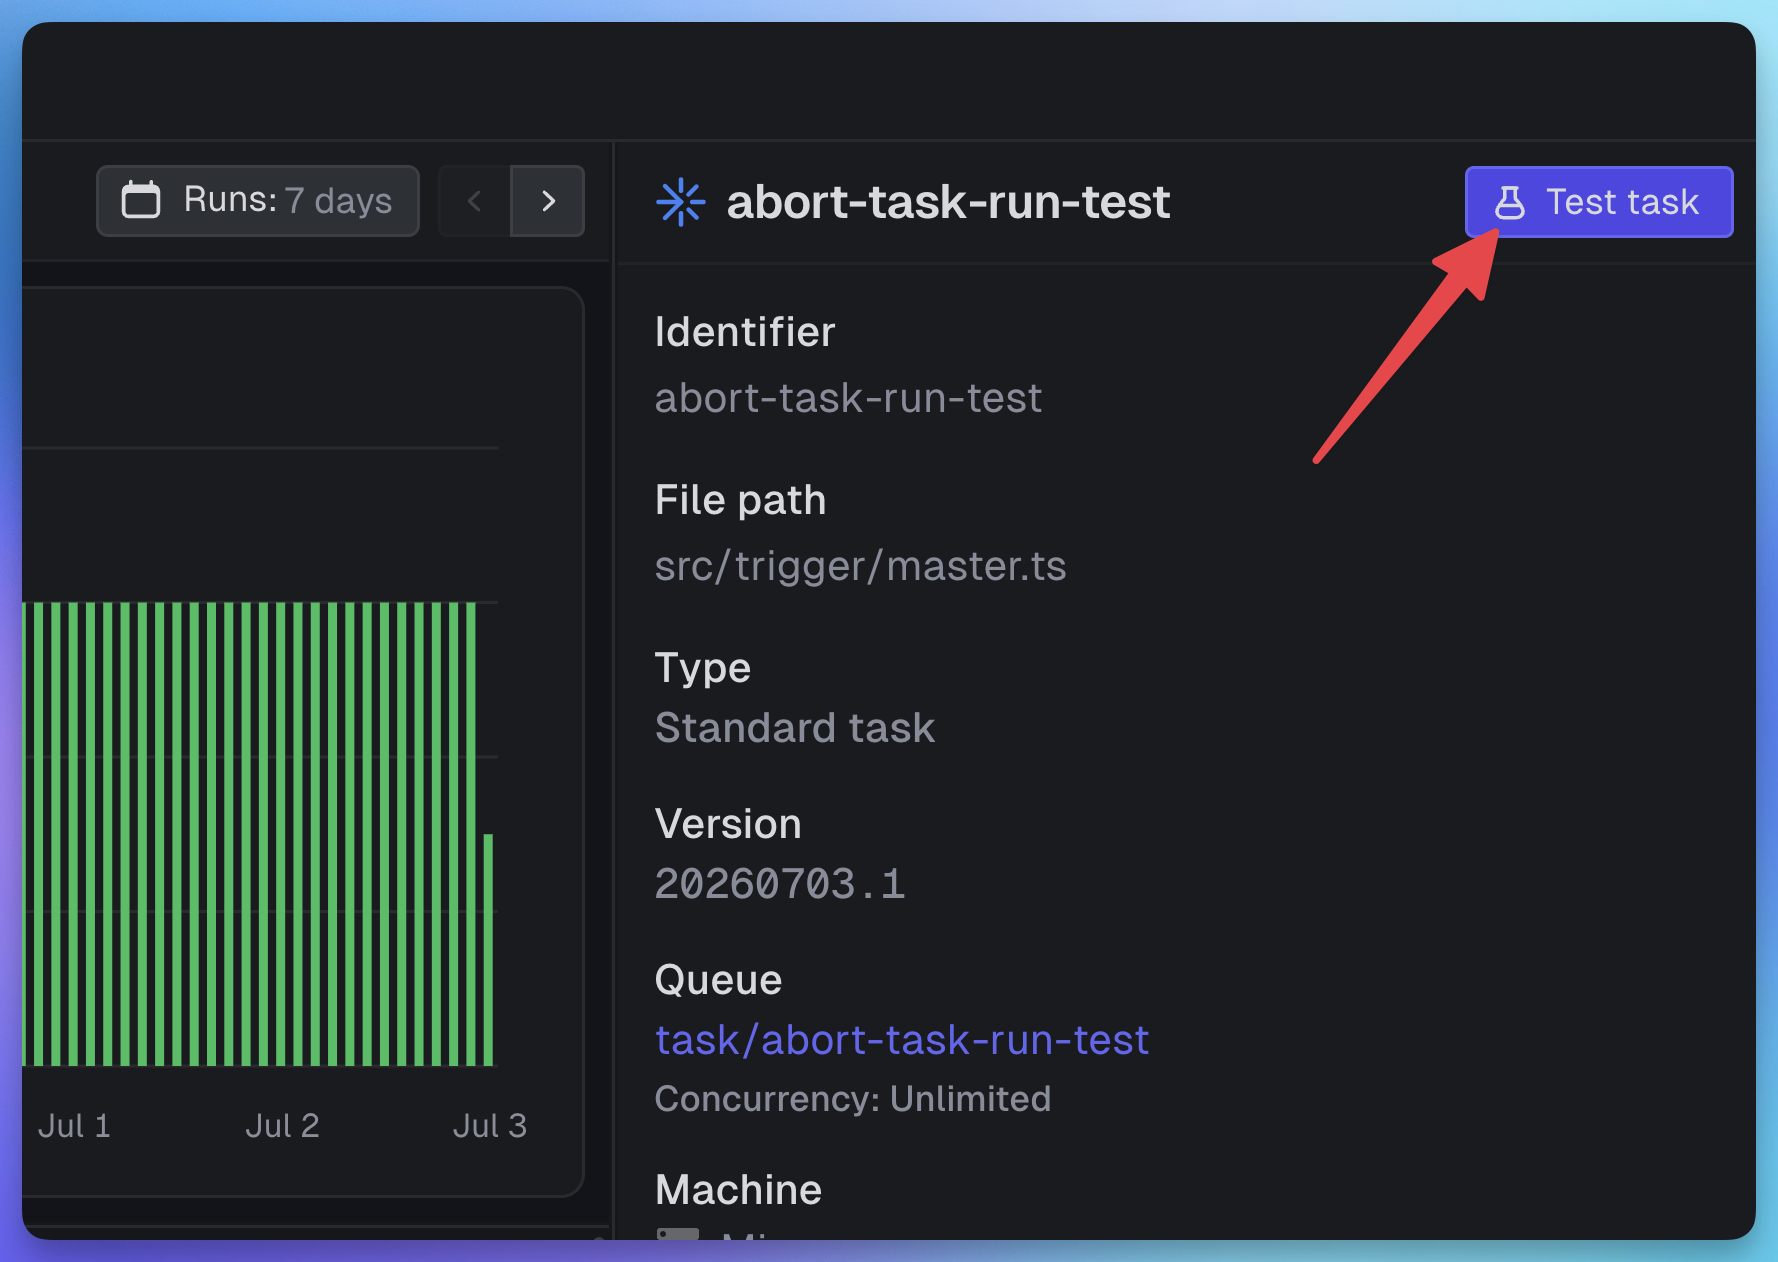
Clicking a task used to drop you straight into its list of runs. Now each task opens a dedicated overview page: key metrics up top, the run list below, the task's metadata alongside, and a direct link to test it.
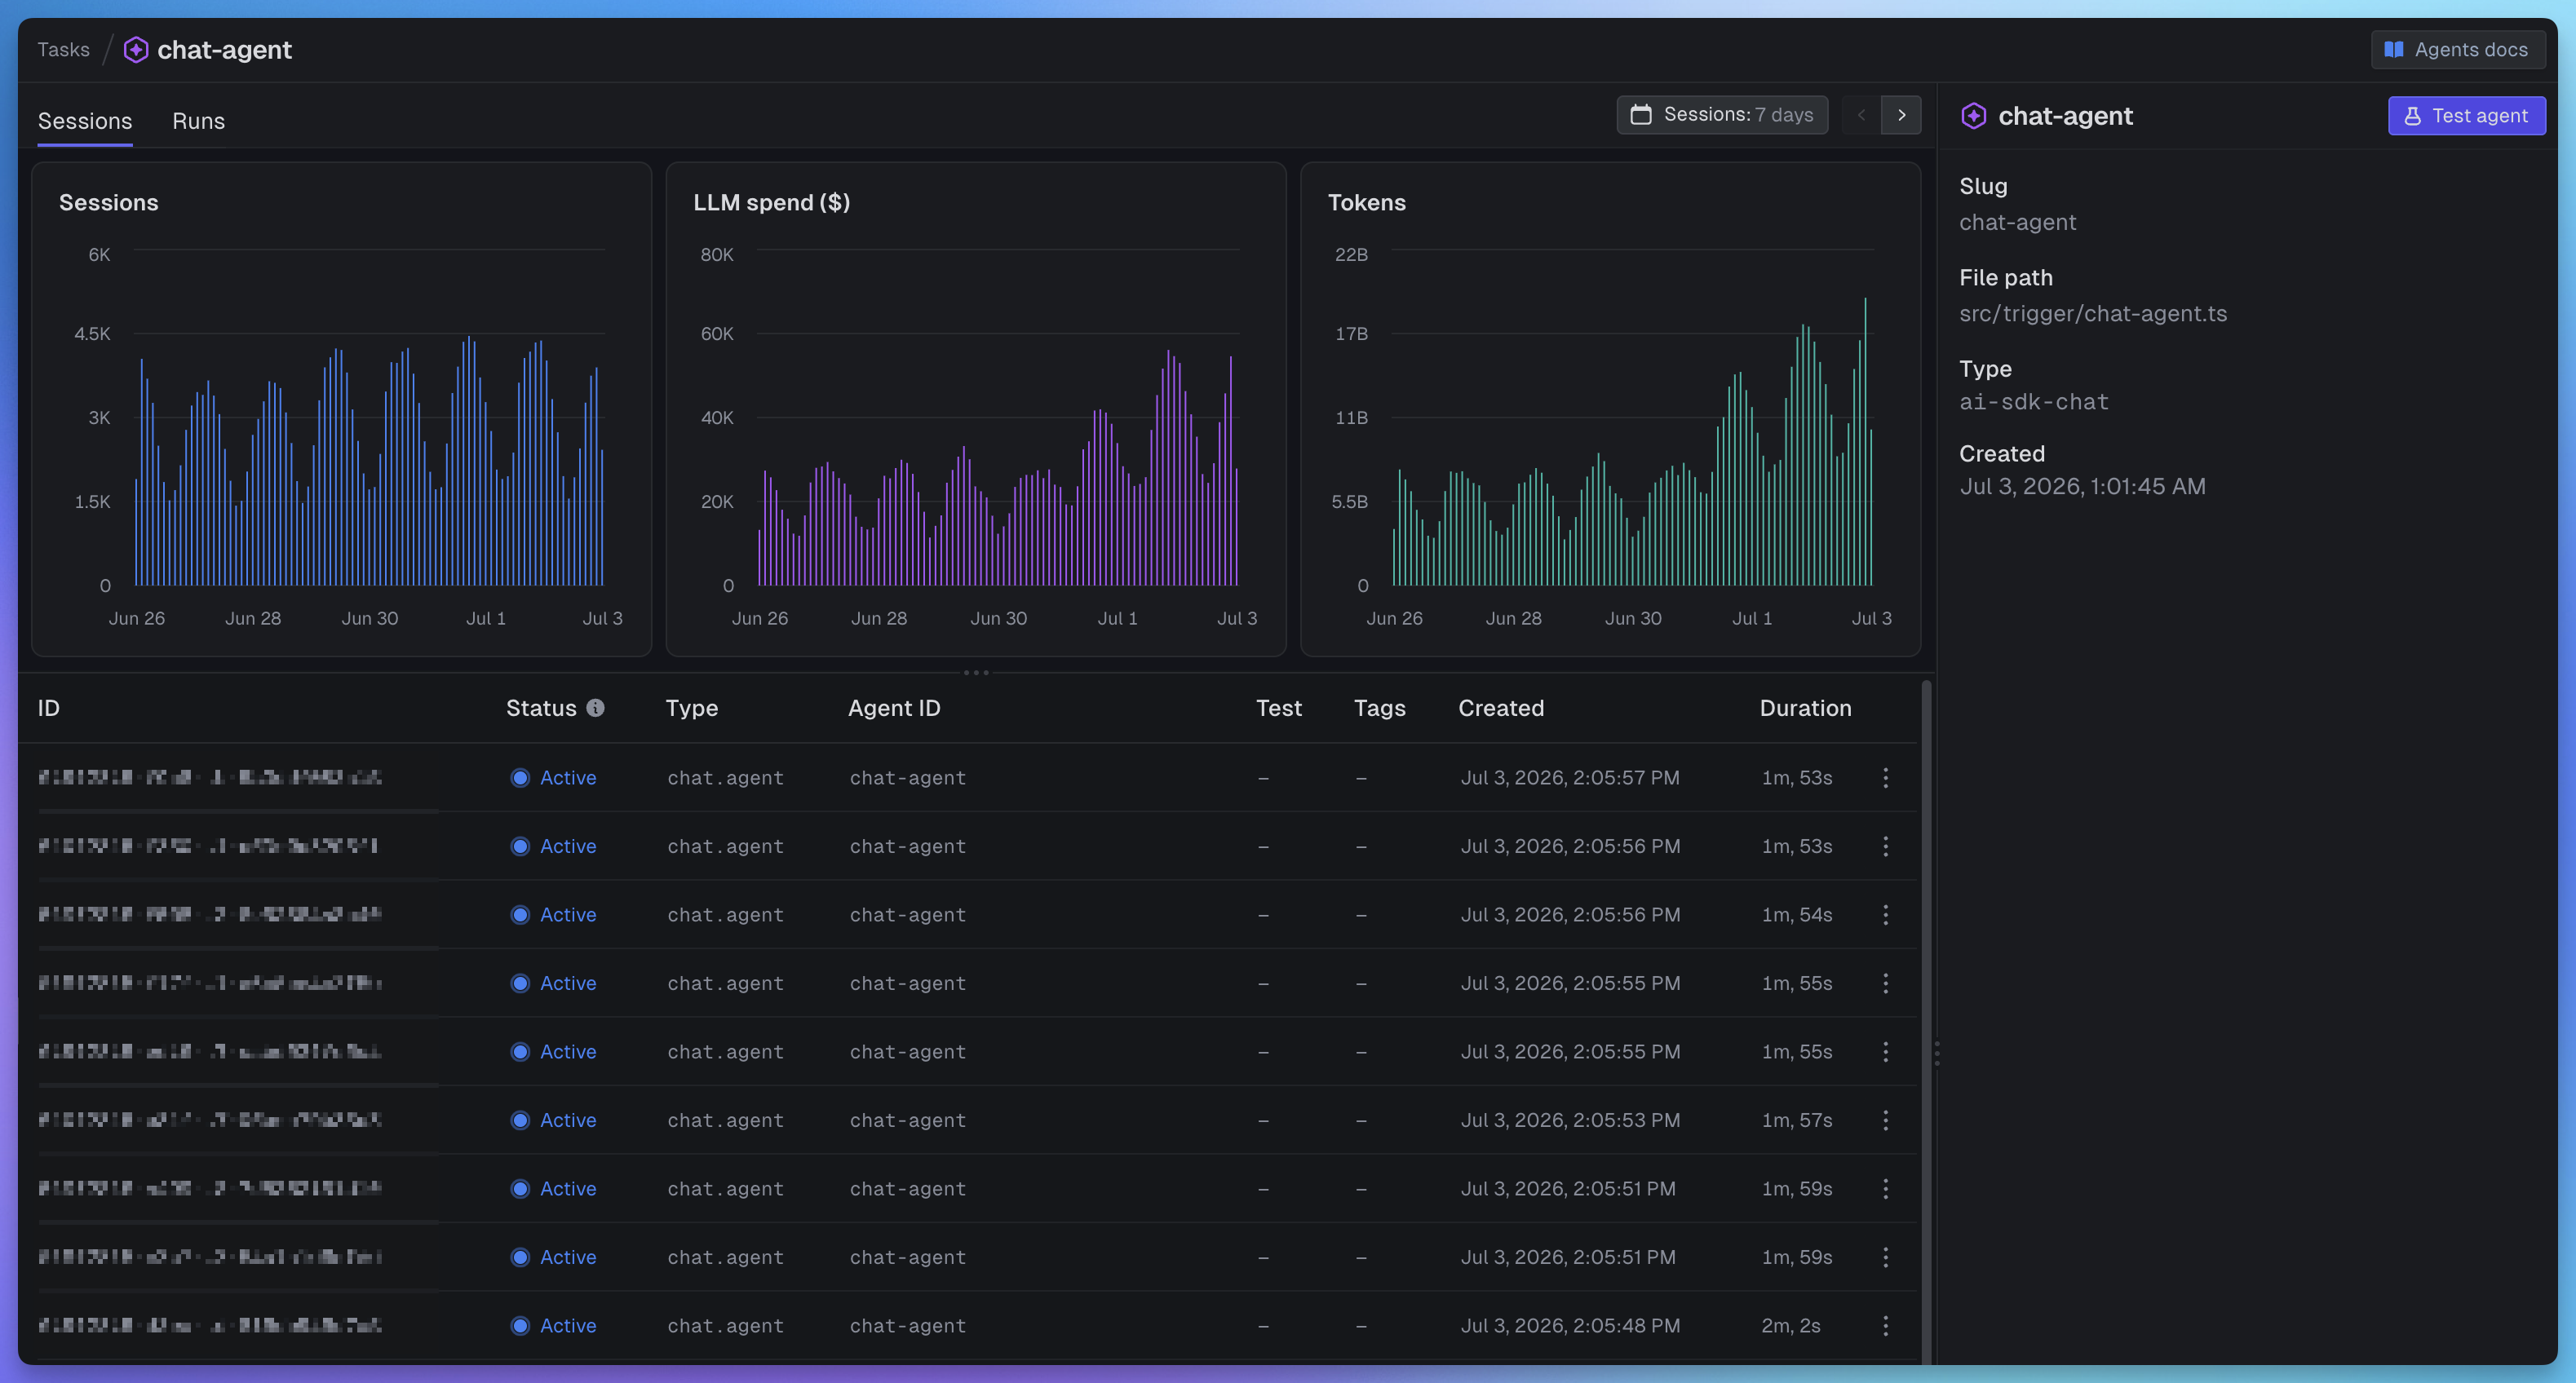
The Test button moved
There used to be a single Test page in the side menu. With three task types that each need a different test interface, one page no longer fit, so we've moved testing closer to the task itself. Two ways in: hover any row on the Tasks page and the Test button appears on the right, or open a task and find Test in the top right of its overview page.
Get started
It's all live now for every project. Open the Tasks page in your dashboard to see it.