
Around 1:45pm (UTC) on August 15 2024 our primary database spiked to 95+% CPU usage and remained there until 7:25pm (UTC). For the first few hours this didn't cause any major problems but as the load increased some database transactions started to elongate and fail.
This caused run queues to become long and some v3 runs to go into the "System failure" state. During this period runs were still being processed but slower than normal.
The cause of this spike was not at all obvious and our standard Postgres debugging techniques didn't work. But before we deepdive into that, let's talk about the impact and what you can do if you have failed runs.
What was impacted?
- Queues got long for v3 and processed slowly.
- Some runs failed with the "System failure" status because API calls were timing out.
- Some actions in the dashboard were slow. Generally the dashboard uses database read replicas but in some cases it needs to use the primary database.
- Some queues became blocked and needed manual intervention to clear. This was caused by a mismatch between Redis (our queue) and Postgres. We have a system in place to detect this and we're going to improve this to have stronger transactional guarantees.
How to bulk replay runs
You can bulk replay failed runs from the dashboard, up to 250 at a time.
This video shows how to:
- Filter for "System failure" runs
- Select two pages of runs
- Then bulk replay them.
When you bulk replay runs it creates a group so you can view the status of those replays and get back to them later.
What happened and why?
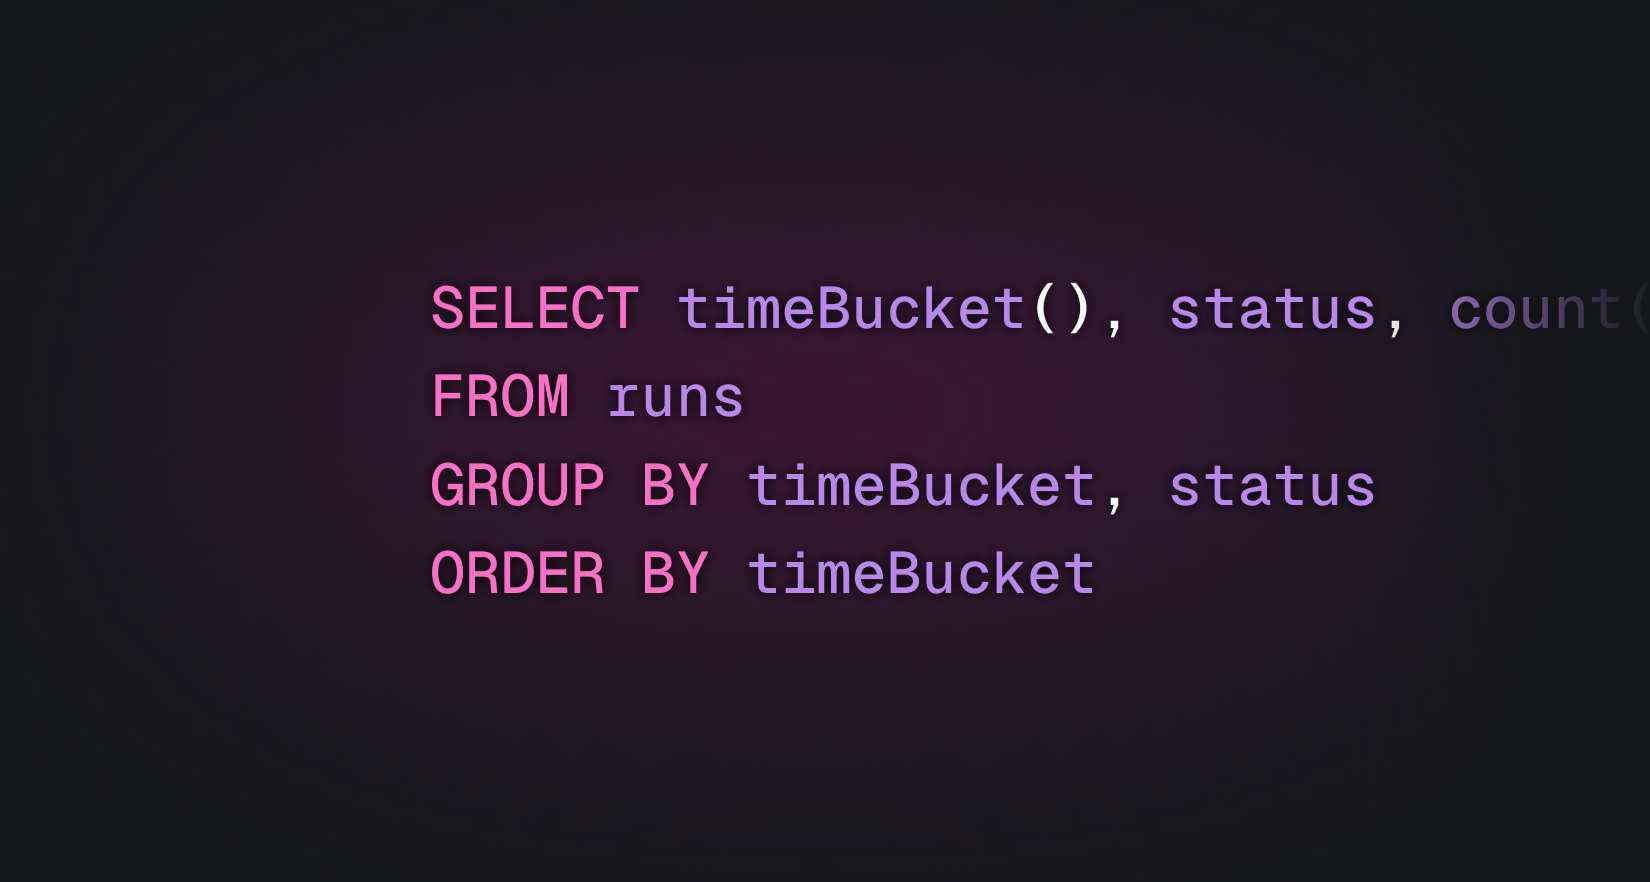
TLDR: Postgres vacuuming stopped working because there was an issue with xmin horizon. This is a very big problem if you're doing sequential scans which is how Graphile Worker works. Graphile Worker is a job queue built on Postgres that we use for some of our internal async processes. This caused unrelated queries and transactions to slow and fail which made it hard to diagnose. All the recommended advice didn't work to unblock vacuuming so we did a "failover" from our primary database to a read replica. That worked.
Detailed timeline and technical deep dive
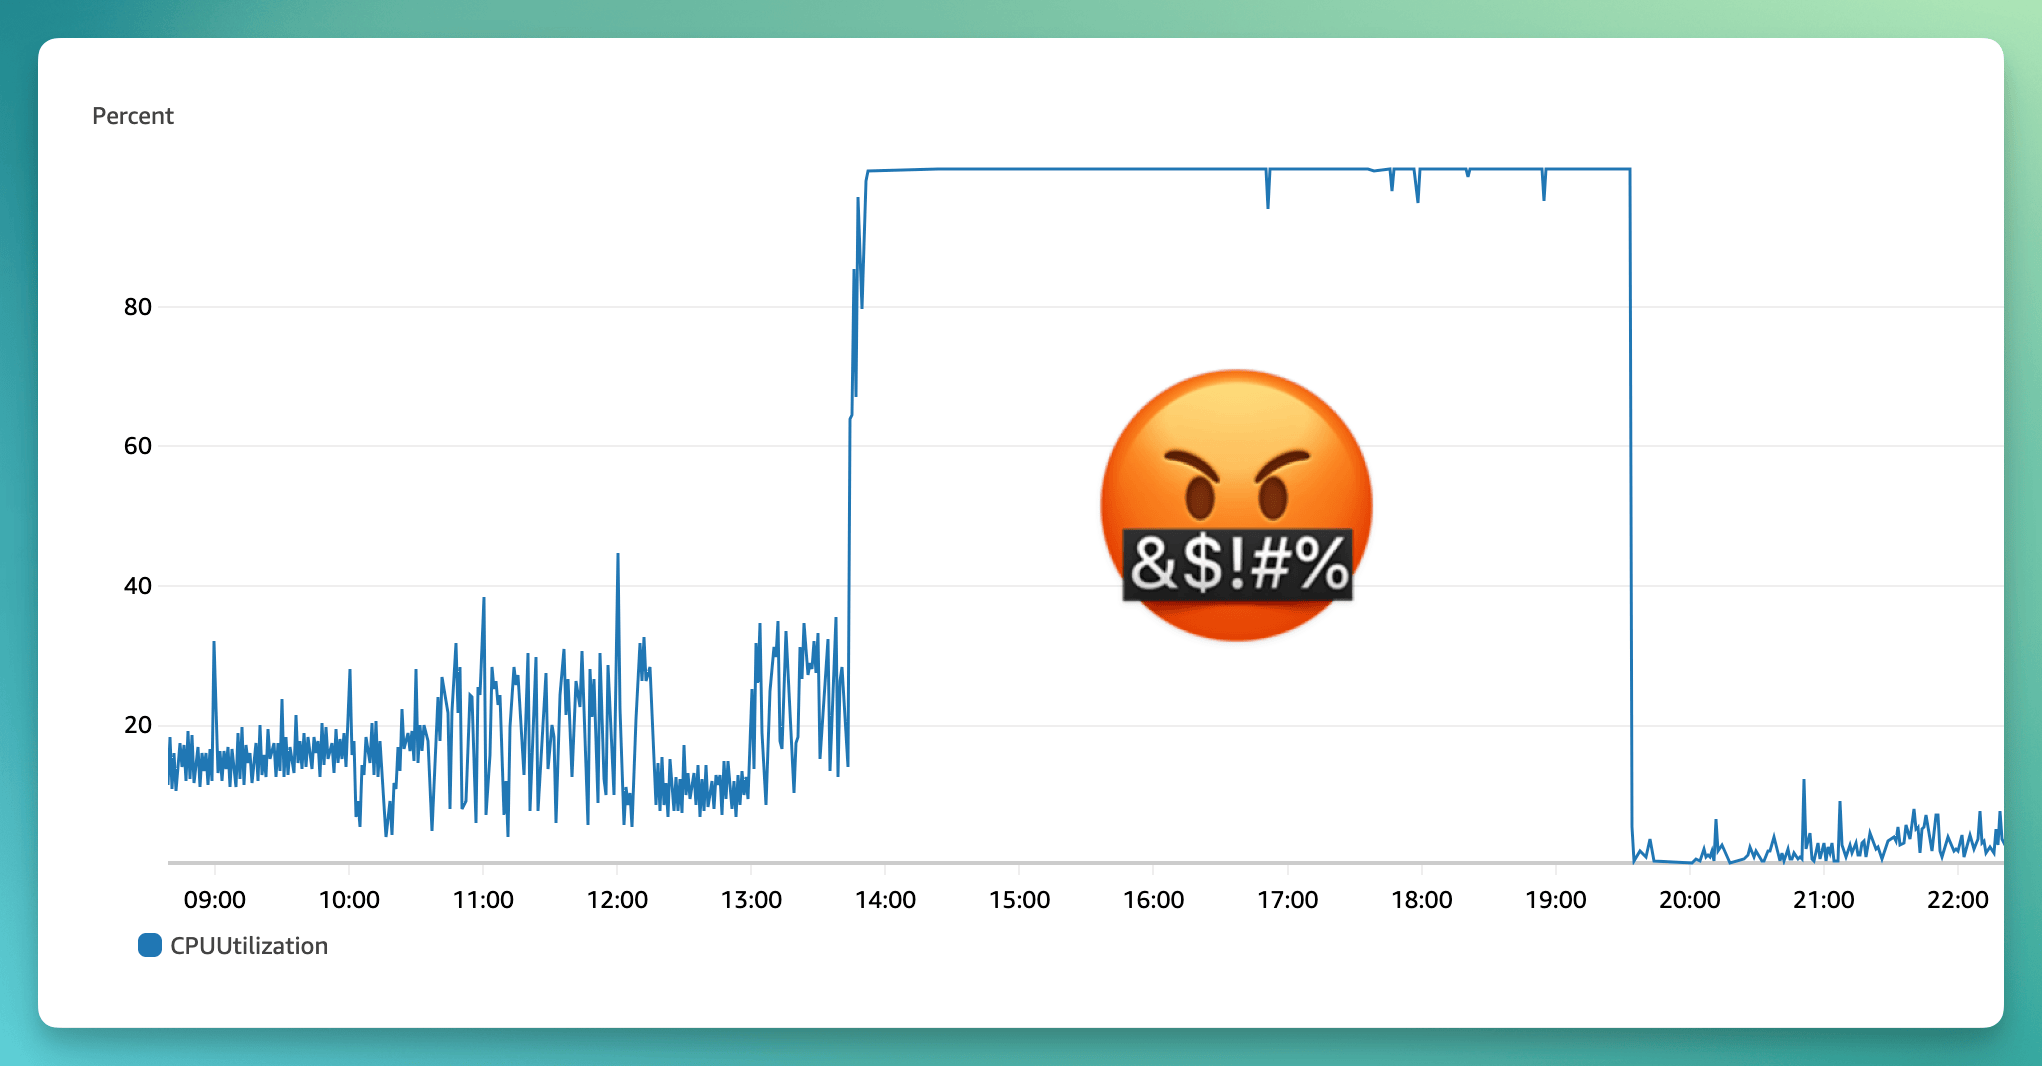
This is definitely not what you want to see when you're looking at your database CPU usage:
This is the number of runs triggered for the same time period as the above graph. The highlighted period is the spike in CPU usage:
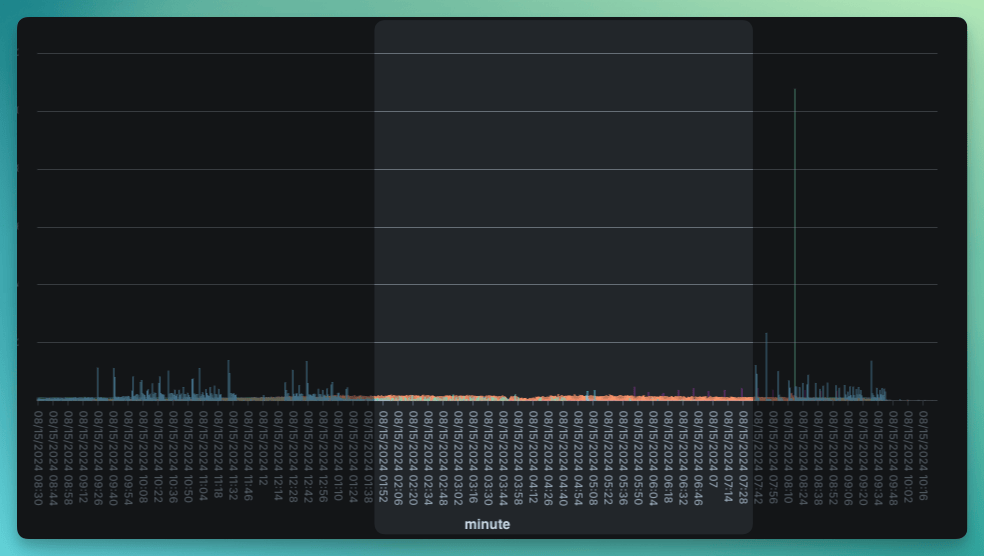
This is a typical distribution and total count of runs for us. That massive spike in runs after the incident, at 8.20pm, caused zero problems and again is fairly typical. Something weird is going on here…
1:45pm UTC: The spike
The primary (writer) database normally runs at between 5–30% CPU usage. At 1:45pm (UTC) it spiked to 99%. We got paged and started investigating.
1:50pm UTC: Normal run volume
It was clear that this wasn't caused by a spike in runs. We have an API rate limit and batch limits to protect against a massive and consistent load. Run logs are stored in Postgres but the volume was also normal.
2:30pm UTC: Performance starts to slowly degrade
There wasn't a spike in the number of Graphile Worker jobs but the queries were slowing down. It's used for internal tasks such as triggering scheduled tasks, sending alert emails, and other internal async tasks. This can be a lot of operations per second. Our primary queue for v3 runs uses Redis and that wasn't directly impacted.
At this point the API, queues and the dashboard were operating normally for users. But the database was still averaging 99% CPU usage.
3:30pm UTC: Low throughput and high latency
The AWS RDS Performance Insights dashboard is useful for debugging Postgres. You can see the number of calls per second, average latency for the top queries, when locks are happening, and more.
The graph below illustrates how bad things were. I've added a solid red line across the Max vCPU so you can see how extreme the difference is.

Digging into the queries we can see that the Graphile queries (blue outline) that are normally very fast are taking 2 seconds. This is an issue because 25 are happening per second, they're blocking other queries, and this throughput is way too low which means we're getting behind. You can see we normally hum along at 100s per second (lots more during busy periods) without breaking a sweat.
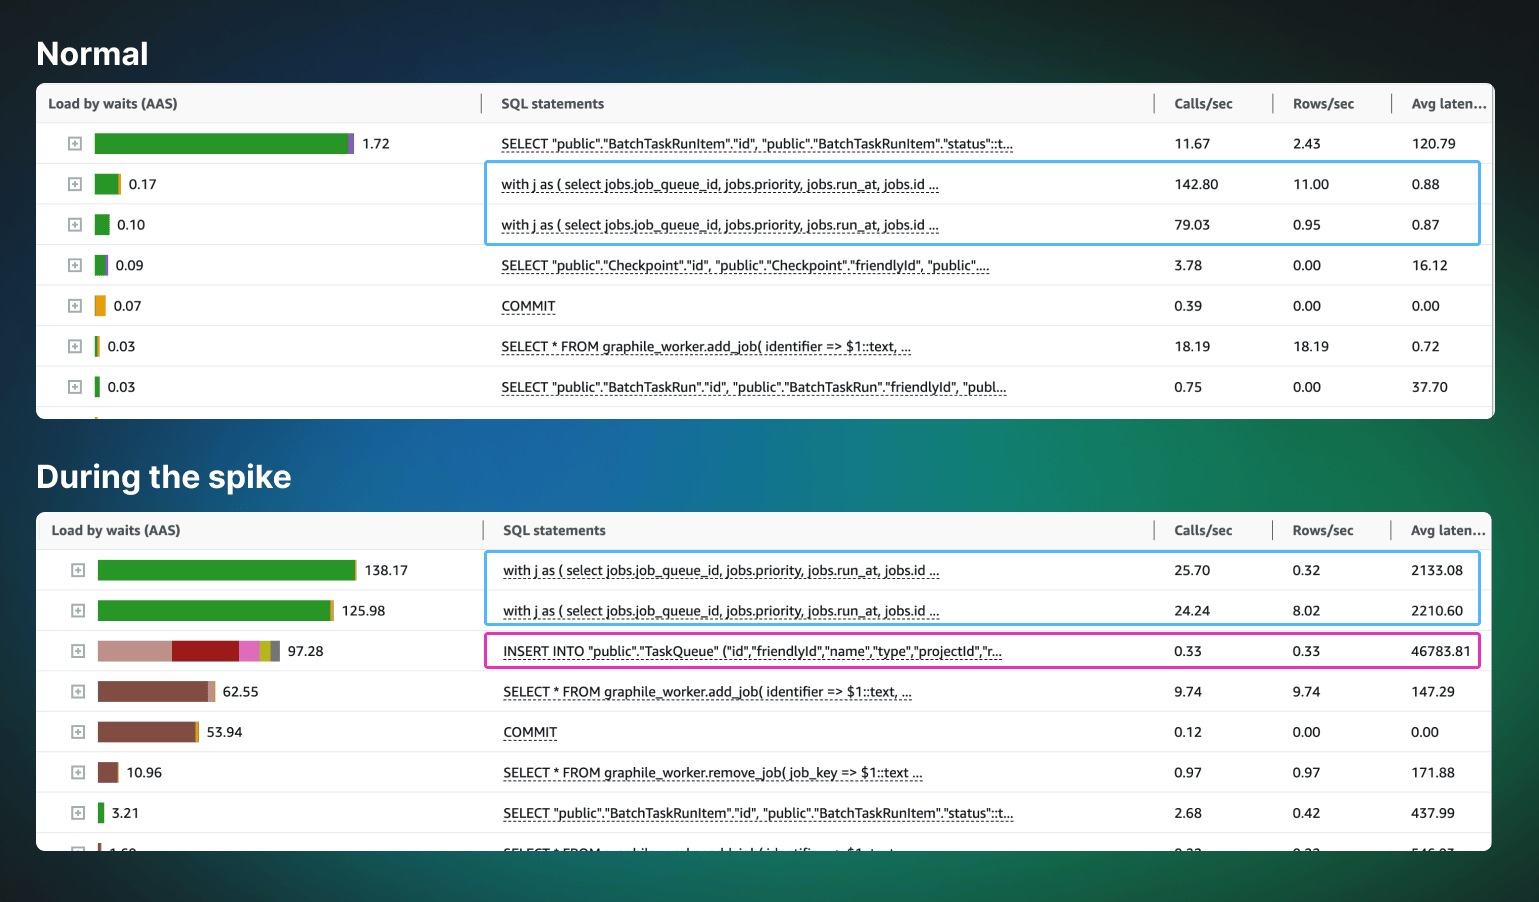
What the hell is this TaskQueue query (pink outline)? It's taking 46 seconds to execute. This really threw us but ultimately put us on the right track to solve the issue, although it didn't cause the problem.
3:45pm UTC: TaskQueue and blocking transactions
When we trigger a task we allow you to pass in a custom queue and concurrency. This allows you to do powerful things like have separate concurrency for each of your users, have free and paid users on different queues, and more.
This slow query kept coming up in the RDS Performance Insights:
This Prisma query translates to a very typical Postgres query that does an INSERT ON CONFLICT UPDATE. It has a unique constraint on the environment + name and the table isn't that large so it should be very fast. But this query was taking 46 seconds to execute.
This was causing the trigger task transactions to fail. We manually cancelled these transactions using pg_cancel_backend to see if that helped. It didn't.
4:45pm UTC: Dead tuples
You can run this query to see how many dead tuples are in a table:
SELECT relname, n_dead_tup, n_live_tup, ( n_dead_tup::float / (n_live_tup + n_dead_tup) * 100 )::int AS dead_percentageFROM pg_stat_user_tablesWHERE n_dead_tup > 0ORDER BY dead_percentage DESC;
There were 600,000 dead tuples (and growing) in the graphile_worker._private_jobs table. This is a big problem.
A dead tuple is a row that has been deleted but not yet vacuumed. This table has a high turnover of rows and so accumulates lots of dead tuples. Postgres should be auto-vacuuming these tables regularly.
Graphile Worker does a sequential scan to find the next job to run. This is usually a very fast operation when the table is small (under 10k rows). One of the first things we checked was that the table was small, but we hadn't checked for dead tuples. Dead tuples matter when you do a sequential scan because Postgres has to skip over them 🤦♂️.
5:00pm UTC: Vacuuming broken and xmin horizon
Why were there so many dead tuples? Running this query showed that vacuuming wasn't working for the Graphile Worker tables:
SELECT schemaname, relname AS table_name, n_live_tup AS live_tuples, n_dead_tup AS dead_tuples, CASE WHEN n_live_tup = 0 THEN 100 ELSE round(n_dead_tup * 100.0 / (n_live_tup + n_dead_tup), 2) END AS dead_tuple_percentage, pg_size_pretty(pg_total_relation_size(relid)) AS total_size, pg_size_pretty(pg_total_relation_size(relid) - pg_relation_size(relid)) AS external_size, last_vacuum, last_autovacuumFROM pg_stat_user_tablesWHERE n_dead_tup > 0ORDER BY dead_tuple_percentage DESC, n_dead_tup DESCLIMIT 20;
The next obvious step was to try vacuuming manually:
VACUUM (VERBOSE, ANALYZE) graphile_worker.job;
Adding VERBOSE gives you useful output like this:
INFO: vacuuming "graphile_worker._private_jobs"INFO: table "_private_jobs": index scan bypassed: 199 pages from table (1.15% of total) have 375 dead item identifiersINFO: launched 0 parallel vacuum workers for index cleanup (planned: 2)INFO: table "_private_jobs": found 0 removable, 669092 nonremovable row versions in 17202 out of 17272 pagesDETAIL: 662319 dead row versions cannot be removed yet, oldest xmin: 1706280686Skipped 70 pages due to buffer pins, 0 frozen pages.CPU: user: 0.06 s, system: 0.01 s, elapsed: 0.16 s.
The oldest xmin is the transaction ID of the oldest transaction that's still running. This is the xmin horizon. We realized that this was preventing vacuuming from working, was progressively getting worse and was causing the CPU spike.
5:30pm UTC: How to unblock this?
We investigated and tried everything that Postgres experts recommend to clean up dead rows.
- Terminating long-running transactions using
pg_terminate_backend() hot_standby_feedback = off- Unused replication slots
- Uncomitted PREPARED transactions
- Was vacuuming getting terminated early?
None of these worked. The xmin horizon was stuck at 1706280686 and we couldn't figure out why.
7:00pm UTC: Failover
We were out of ideas on how to get vacuuming to work on the primary database.
We decided the best option was to promote a read replica to be the primary database. This is called a "failover" in AWS RDS.
First we added an extra read replica. When the failover happens the primary becomes a read replica and we weren't confident that instance would drop from 100% CPU and be usable.
In total the switch took less than 60 seconds. The new primary database was operating at 4% CPU usage and vacuuming began working as expected. The xmin horizon became unblocked… 🤷♂️

What did we learn?
- We should have been monitoring dead tuples: If you have high row deletions you should be monitoring dead tuples. This is especially important if you're doing sequential scans.
- Vacuuming is very important: We should have been monitoring vacuuming more closely and have realized that it wasn't working as expected.
- Failover is a good option: We should have considered performing a failover earlier. We didn't think such a crude option would work and were worried about the impact on the dashboard and API, but in the end the very brief downtime was the best option.
What we're doing to prevent this from happening again
- Monitoring: We've setup pganalyze to monitor our Postgres databases. This will alert us of issues with vacuuming, dead tuples, and other potential Postgres performance issues. It also provides proactive advice on config, queries and indexes.
- Eventual consistency: For v3 we use Redis for our task queue, this is a good choice because it has very high throughput and low latency. It also enables powerful queuing features like per-tenant concurrency. But it does make consistency with Postgres harder. We're going to improve our system to have stronger transactional guarantees between Redis and Postgres.
We take reliability and queue throughput very seriously so this incident really hurt. It was both difficult to diagnose and fix.
We're really sorry to everyone impacted.