The following is a tale of how we discovered and fixed a variety of reliability and performance issues in our Node.js application that were caused by Node.js event loop lag.
The discovery
At around 11pm local time (10pm UTC) on Thursday June 20, we were alerted to some issues in our production services powering the Trigger.dev cloud, as some of our dashboard/API instances started crashing.
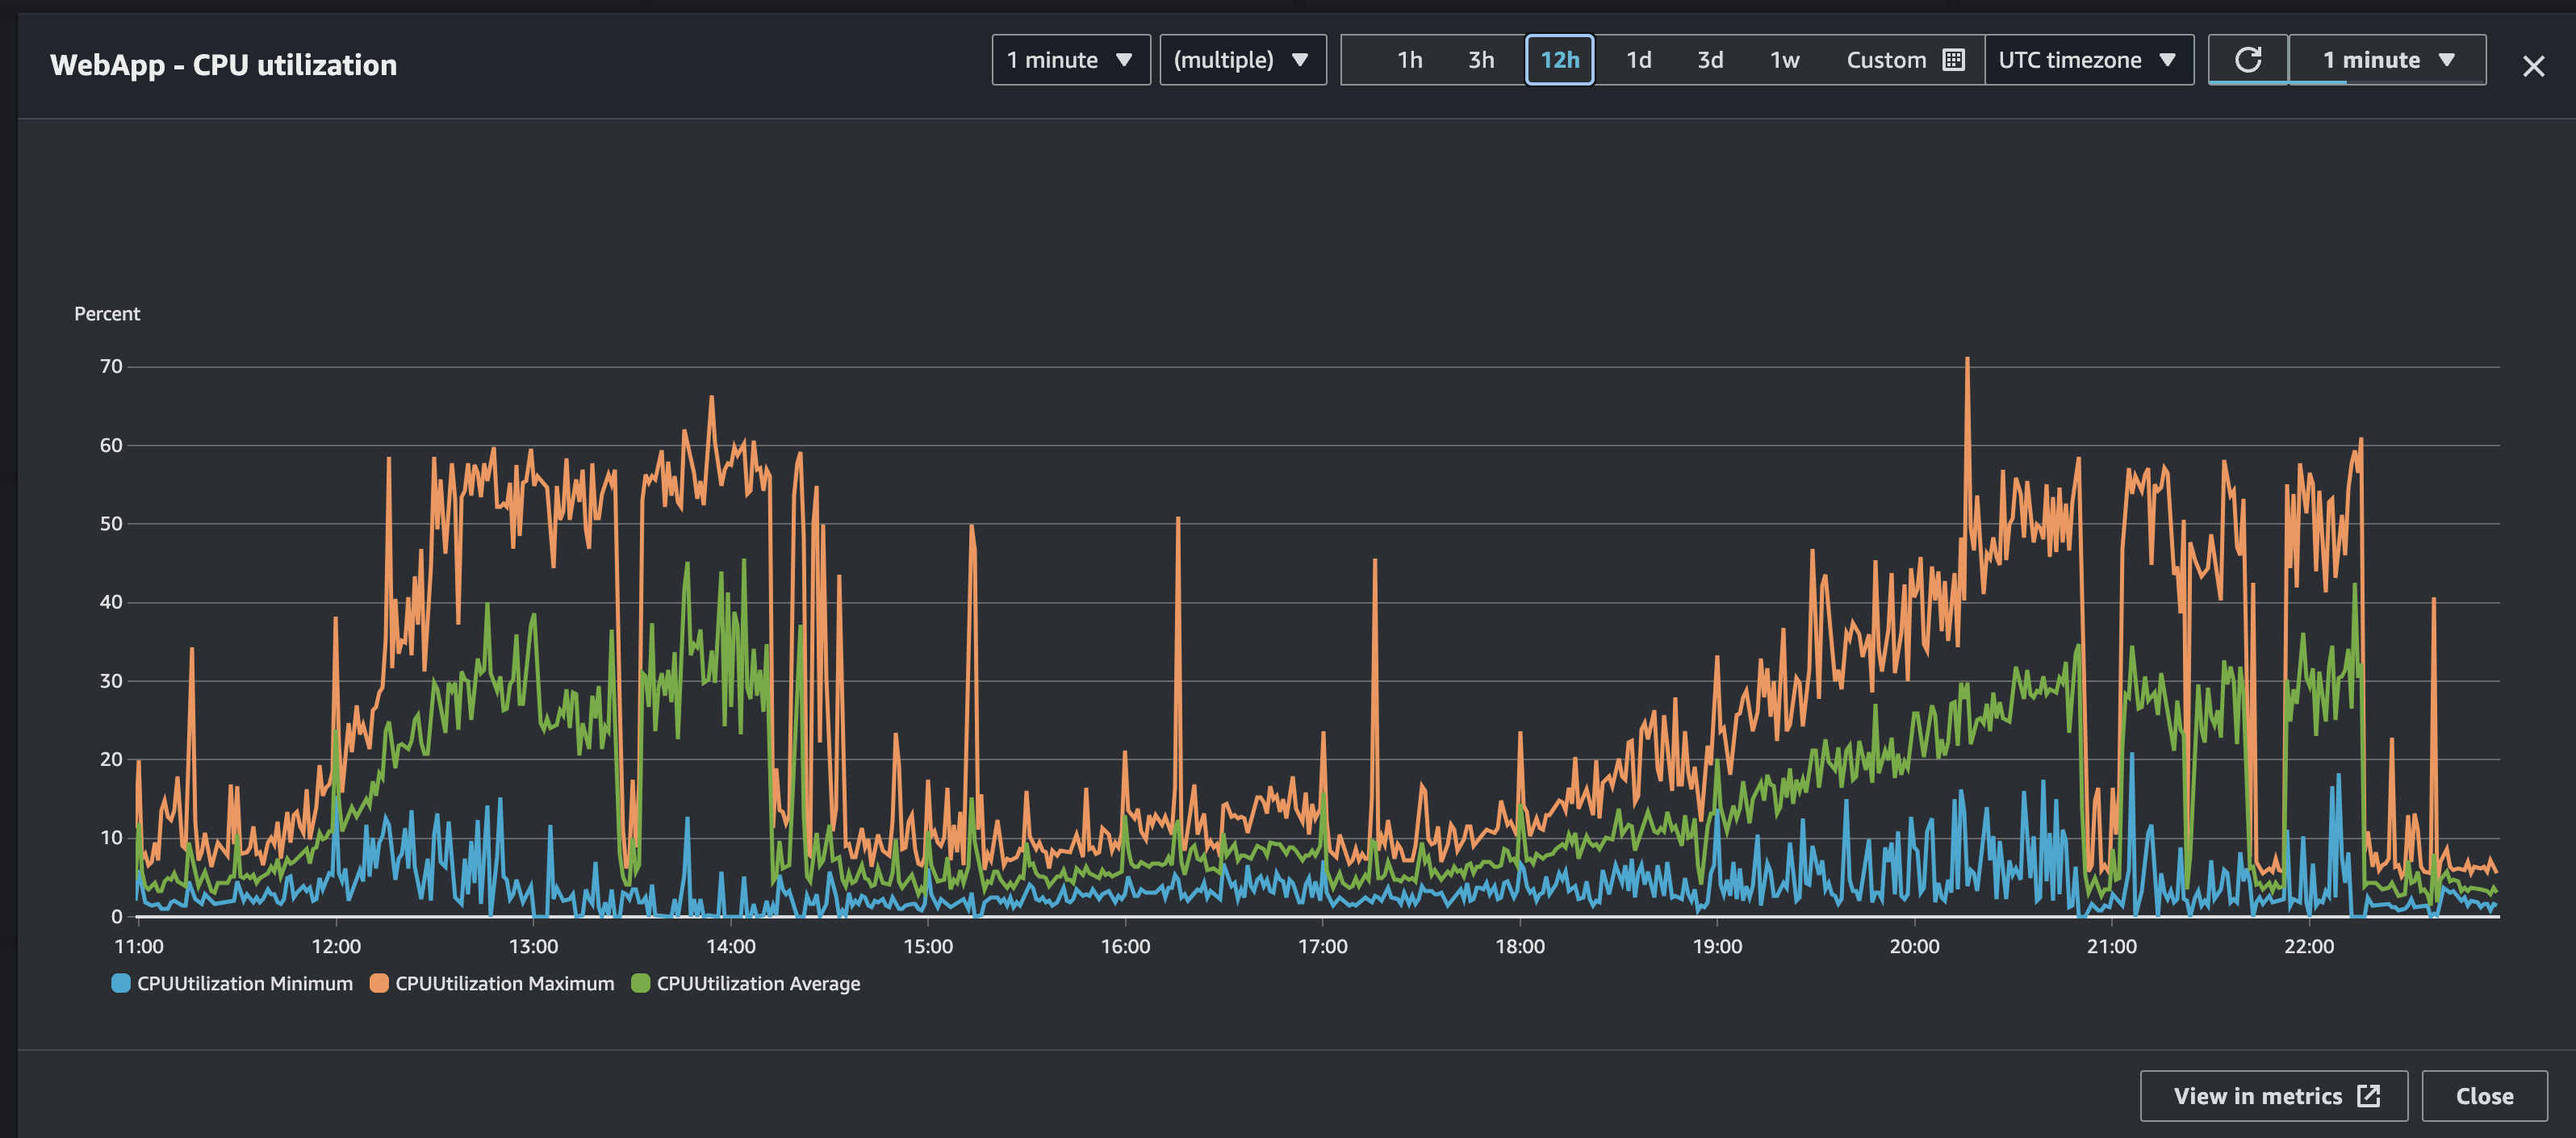
We hopped on to our AWS production dashboard and saw that the CPU usage of our instances were really high and growing.
Combing through the logs on the crashed instances, we came across various errors, such as Prisma transaction timeouts:
Error: Invalid `prisma.taskAttempt.create()` invocation:Transaction API error: Transaction already closed: A query cannot be executed on an expired transaction. The timeout for this transaction was 5000 ms, however 6385 ms passed since the start of the transaction.
Followed by a message from Prisma stating they were unable to find the schema.prisma file and an uncaught exception, leading to the process exiting:
Error: Prisma Client is unable to find the Prisma schema file for this project. Please make sure the file exists at /app/prisma/schema.prisma.
We were puzzled by these errors, as the load on our primary database was consistently under 10% and the number of connections was healthy. We were also seeing other errors causing crashing, such as sending WebSocket messages to an already closed connection (which yes, throws an exception)
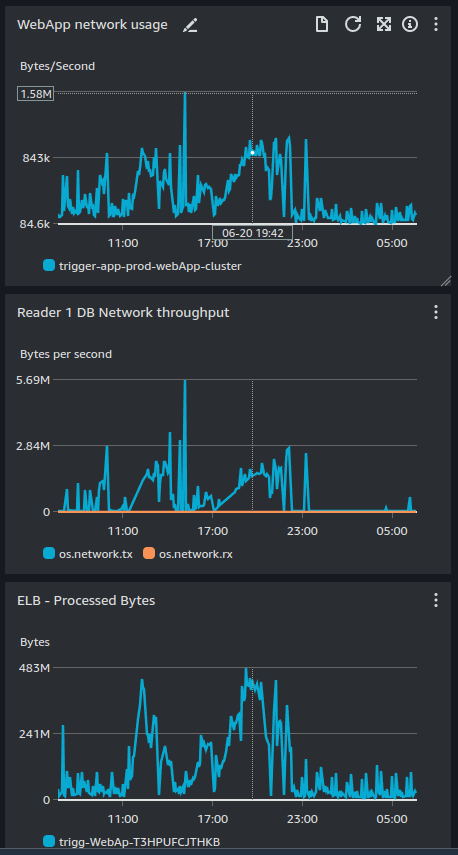
At the same time, we noticed that our network traffic was spiking, which was odd as we weren't seeing a corresponding increase in requests to our API:
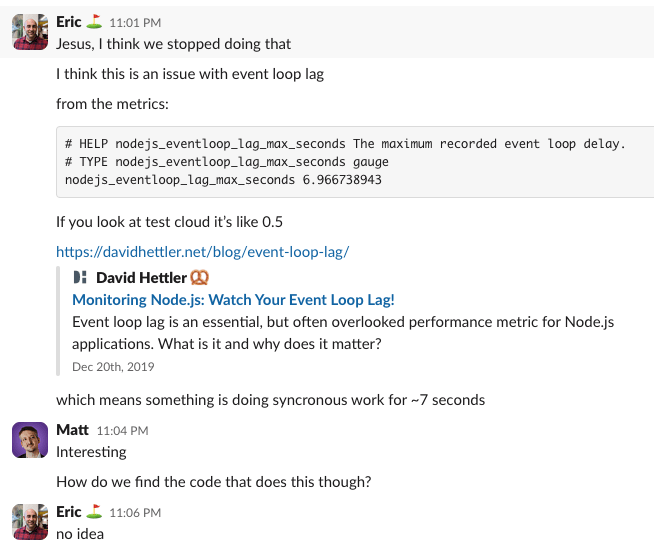
Just past 1am local time, we deployed a couple things we had hoped would fix the issue (spoiler: they did not). While waiting for the deploy to complete, I hit our metrics endpoint and was hoping to find some clues. I indeed did find something:
The deploy finished and the CPU usage dropped and the crashes stopped, so we were hopeful we had fixed the issue and went to bed.
The issue returns
The next morning, we woke up to the same issue. The CPU usage was high again, the database was steady, and the network traffic was high. We were back to square one.
We had a hunch that if we could get a better idea behind the spikes in network traffic, we could find the root cause of the issue. We had access to AWS Application Load Balancer logs, so we setup the ability to query them in Athena and started by looking at the IPs with the most usage:
SELECT client_ip, COUNT(*) as request_count, sum(received_bytes) / 1024 / 1024 as rx_total_mb, sum(sent_bytes) / 1024 / 1024 as tx_total_mbFROM alb_logsWHERE day = '2024/06/20'GROUP BY client_ipORDER BY tx_total_mb desc;
Which showed a pretty clear winner:
That's 21GB of data used by a single IP address in a single day. We wrote another query to see what paths this IP was hitting and causing the high network traffic:
SELECT client_ip, COUNT(*) as request_count, min(time) as first_request, max(time) as last_request, sum(received_bytes) / 1024 / 1024 as rx_total_mb, sum(sent_bytes) / 1024 / 1024 as tx_total_mb, request_verb, request_urlFROM alb_logsWHERE day = '2024/06/20' and client_ip = '93.xxx.xxx.155'GROUP BY client_ip, request_verb, request_urlORDER BY tx_total_mb desclimit 1000;
Most of the traffic was coming from just a few different paths, but they were all pointing to our v3 run trace view (just an example):
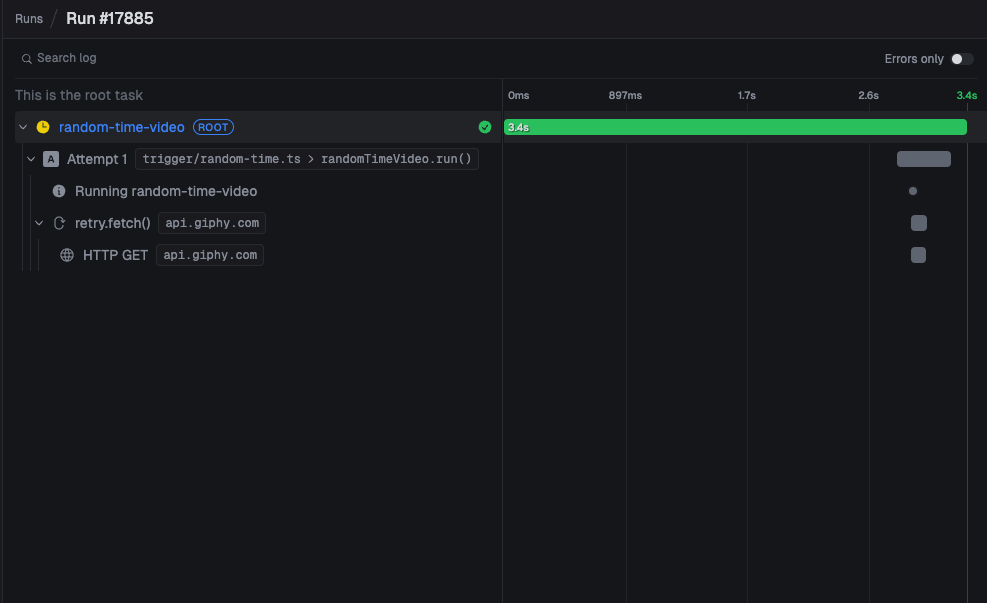
But the query above showed just a few paths, with thousands of requests each. We dug into the database and saw that these runs had 20k+ logs each, and our trace view lacked pagination. We also "live reload" the trace view as new logs come in, at most once per second.
So someone was triggering a v3 run, and viewing the trace view, as 20k+ logs came in, refreshing the entire page every second. This was causing the high network traffic, but doesn't explain the high CPU usage.
The next step to uncovering the root cause was to instrument the underlying code with some additional telemetry. Luckily we already have OpenTelemetry setup in our application, which sends traces to Baselime.io. After adding additional spans to the code we started seeing traces like this:
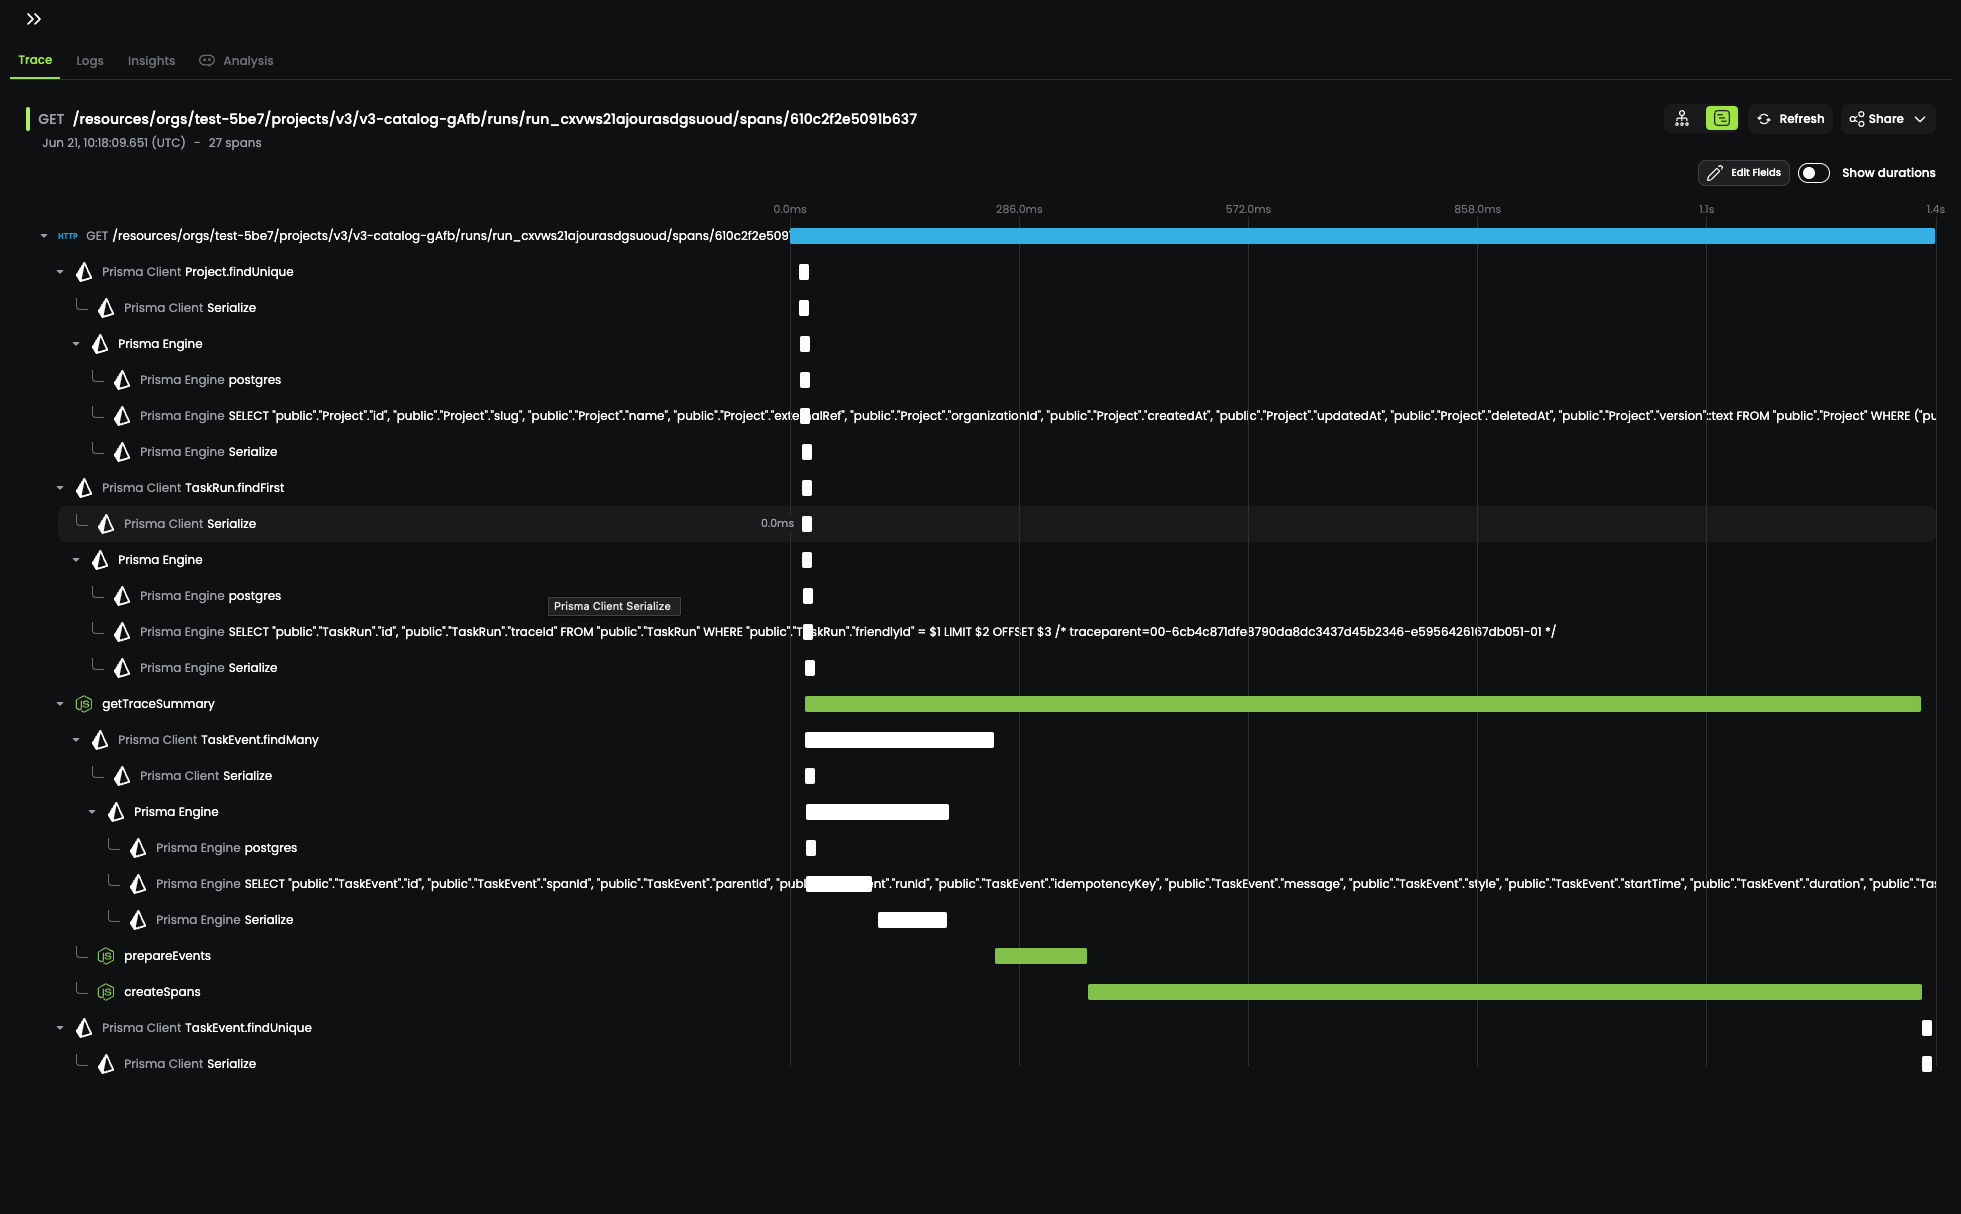
As you can see in that trace above, a large amount of time was being spent inside the createSpans span. After about 30 seconds of digging, it was pretty clear what the issue was:
// This isn't the actual code, but a simplified versionfor (const log of logs) { // remember, 20k+ logs const parentSpan = logs.find((l) => log.parentId === l.id);}
Yup, that's a nested loop. We were iterating over 20k+ logs, and for each log, we were iterating over all the logs again to find the parent log (20k * 20k = 400m). In Big O notation, this is O(n^2), which is not great (it's really bad).
We fixed the issue by creating a map of logs by ID, and then iterating over the logs once to create the spans. We quickly deployed the fix (along with limiting live-reloading the trace view when there are less than 1000 logs) and the CPU usage dropped, the network traffic dropped, and the crashes stopped (for now).
With this one issue fixed, we returned our attention to the event loop lag we had discovered the night before. We had squashed one instance of it, but we had a feeling this wasn't the only place it was causing issues.
Before we dive into how we discovered and fixed the rest of our event loop lag issues, let's take a step back and explain what event loop lag is.
Event loop lag: a primer

Node.js only has a small amount of threads of operation, with the event-loop belonging to the main thread. That means that for every request that comes in, it's processed in the main thread.
This allows Node.js services to run with much more limited memory and resource consumption, as long as the work being done on the main thread by each client is small.
In this way Node.js is a bit like your local coffee shop, with a single barista. As long as no-one orders a Double Venti Soy Quad Shot with Foam, the coffee shop can serve everyone quickly. But one person can slow the whole process down and cause a lot of unhappy customers in line.
So how can this possibly scale? Well, Node.js actually will offload some work to other threads:
- Reading and writing files (libuv) happens on a worker thread
- DNS lookups
- IO operations (like database queries) are done on worker threads
- Crypto and zlib, while CPU heavy, are also offloaded to worker threads
The beauty of this setup is you don't have to do anything to take advantage of this. Node.js will automatically offload work to worker threads when it can.
The one thing Node.js asks of you, the application developer, is to fairly distribute main-thread work between clients. If you don't, you can run into event loop lag, leading to a long queue of angry clients waiting for their coffee.
Luckily, the Node.js team has published a pretty comprehensive guide on how to avoid event loop lag, which you can find here.
Monitoring event loop lag
After deploying the fix for the nested loop issue, we wanted to get a better idea of how often we were running into event loop lag. We added an event loop monitor to our application that would produce a span in OpenTelemetry if the event loop was blocked for more than 100ms:
import { createHook } from "node:async_hooks";import { tracer } from "/blog/event-loop-lag/tracer.server";const THRESHOLD_NS = 1e8; // 100msconst cache = new Map<number, { type: string; start?: [number, number] }>();function init( asyncId: number, type: string, triggerAsyncId: number, resource: any) { cache.set(asyncId, { type, });}function destroy(asyncId: number) { cache.delete(asyncId);}function before(asyncId: number) { const cached = cache.get(asyncId); if (!cached) { return; } cache.set(asyncId, { ...cached, start: process.hrtime(), });}function after(asyncId: number) { const cached = cache.get(asyncId); if (!cached) { return; } cache.delete(asyncId); if (!cached.start) { return; } const diff = process.hrtime(cached.start); const diffNs = diff[0] * 1e9 + diff[1]; if (diffNs > THRESHOLD_NS) { const time = diffNs / 1e6; // in ms const newSpan = tracer.startSpan("event-loop-blocked", { startTime: new Date(new Date().getTime() - time), attributes: { asyncType: cached.type, label: "EventLoopMonitor", }, }); newSpan.end(); }}export const eventLoopMonitor = singleton("eventLoopMonitor", () => { const hook = createHook({ init, before, after, destroy }); return { enable: () => { console.log("🥸 Initializing event loop monitor"); hook.enable(); }, disable: () => { console.log("🥸 Disabling event loop monitor"); hook.disable(); }, };});
The code above makes use of node:async_hooks to capture and measure the time spent between the before and after hooks. If the duration between the two is greater than 100ms, we create a span in OpenTelemetry, making sure to set the startTime to the time the before hook executed.
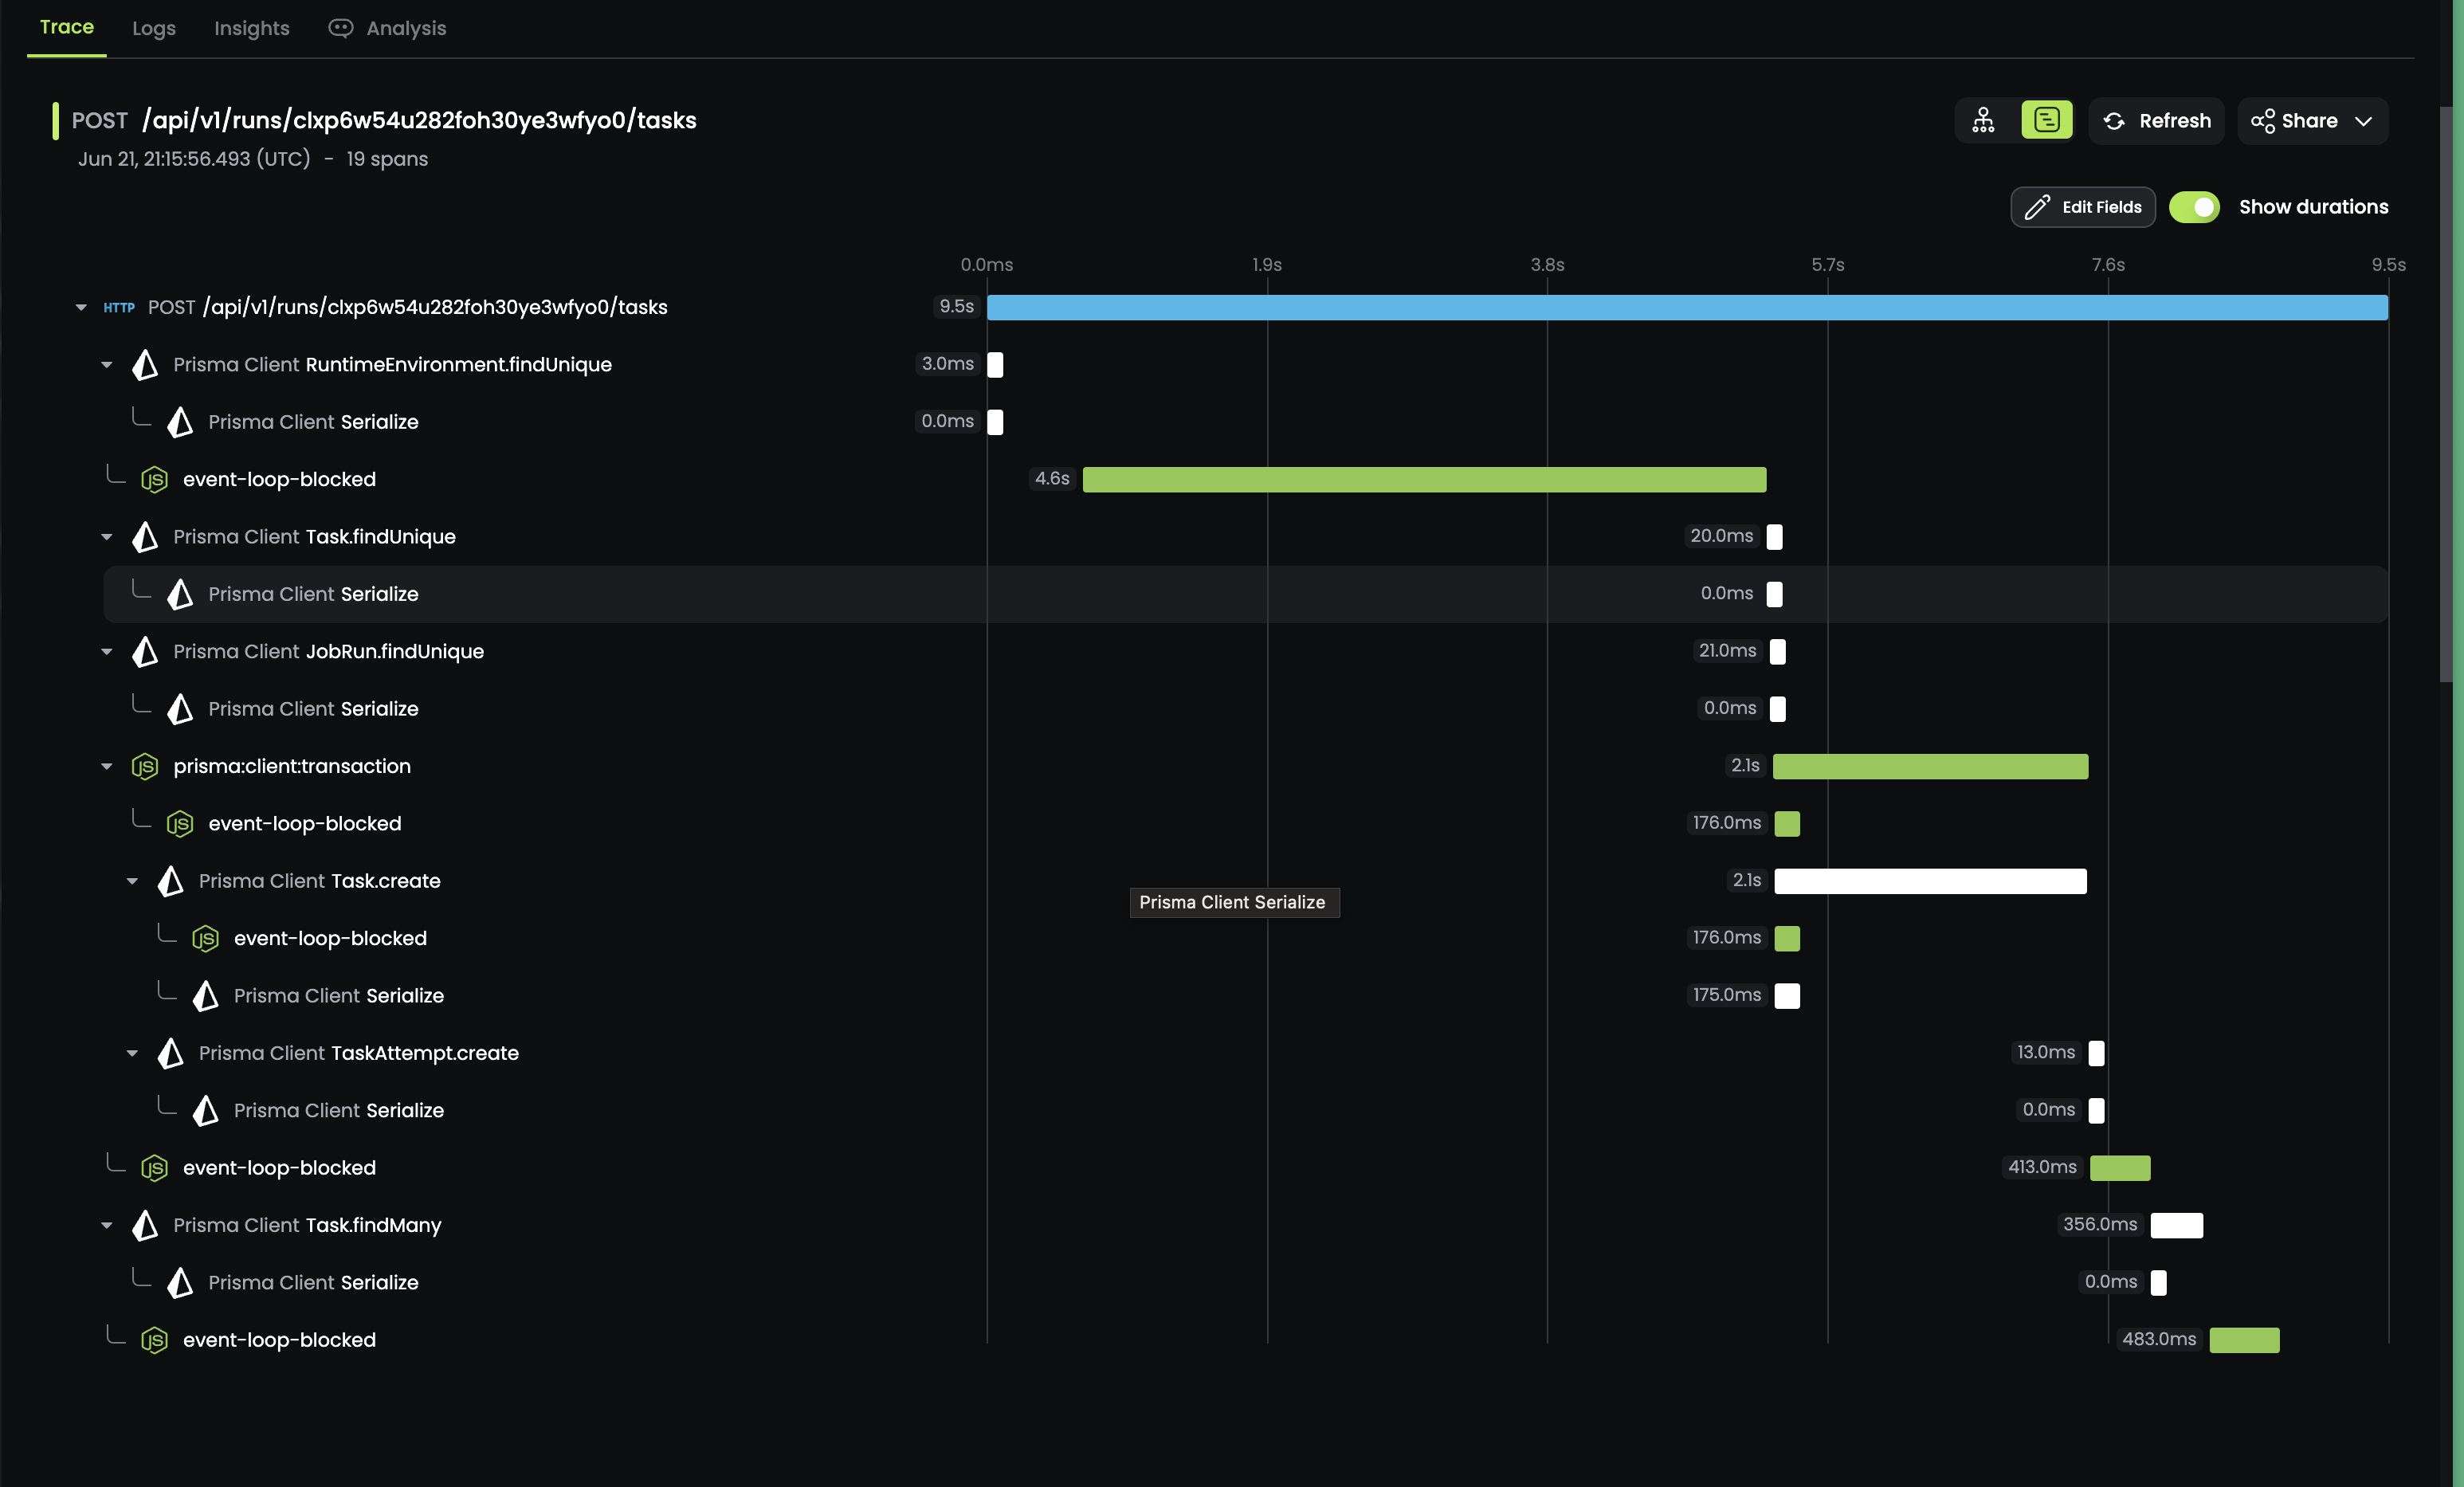
We deployed the monitor on Friday afternoon and waited for the results. Around 10pm local time, we started seeing spans being created with pretty large durations:

Event loop lag whack-a-mole
Starting the morning of Monday the 24th, we started on a PR to fix as many of the event loop lag issues as we could. We submitted and deployed the PR around 10am UTC on Thursday the 27th with the following fixes:
- Added a limit of 25k logs to the trace view (after discovering a run with 222k logs). Added a "download all logs" button to allow users to download all logs if they needed them.
- Added pagination to our v2 schedule trigger list after we saw a 15s lag when a user had 8k+ schedules.
- Added a hard limit of 3MB on the input to a v2 task (after realizing we didn't have a limit at all), which matches the output limit on v2 tasks.
- Importantly, we changed how we calculated the size of the input and output of a v2 task. Previously, we were using
Buffer.byteLengthafter having parsed the JSON of the request body. This was causing the event loop to block while calculating the size of the input and output. We now calculate the size of the input and output before parsing the JSON, using theContent-Lengthheader of the request. - We use Zod to parse incoming JSON request bodies, and removing the keys for the input and output of v2 tasks and handling them separately.
After deploying these fixes, we saw a significant drop in the number of spans being created by the event loop monitor:
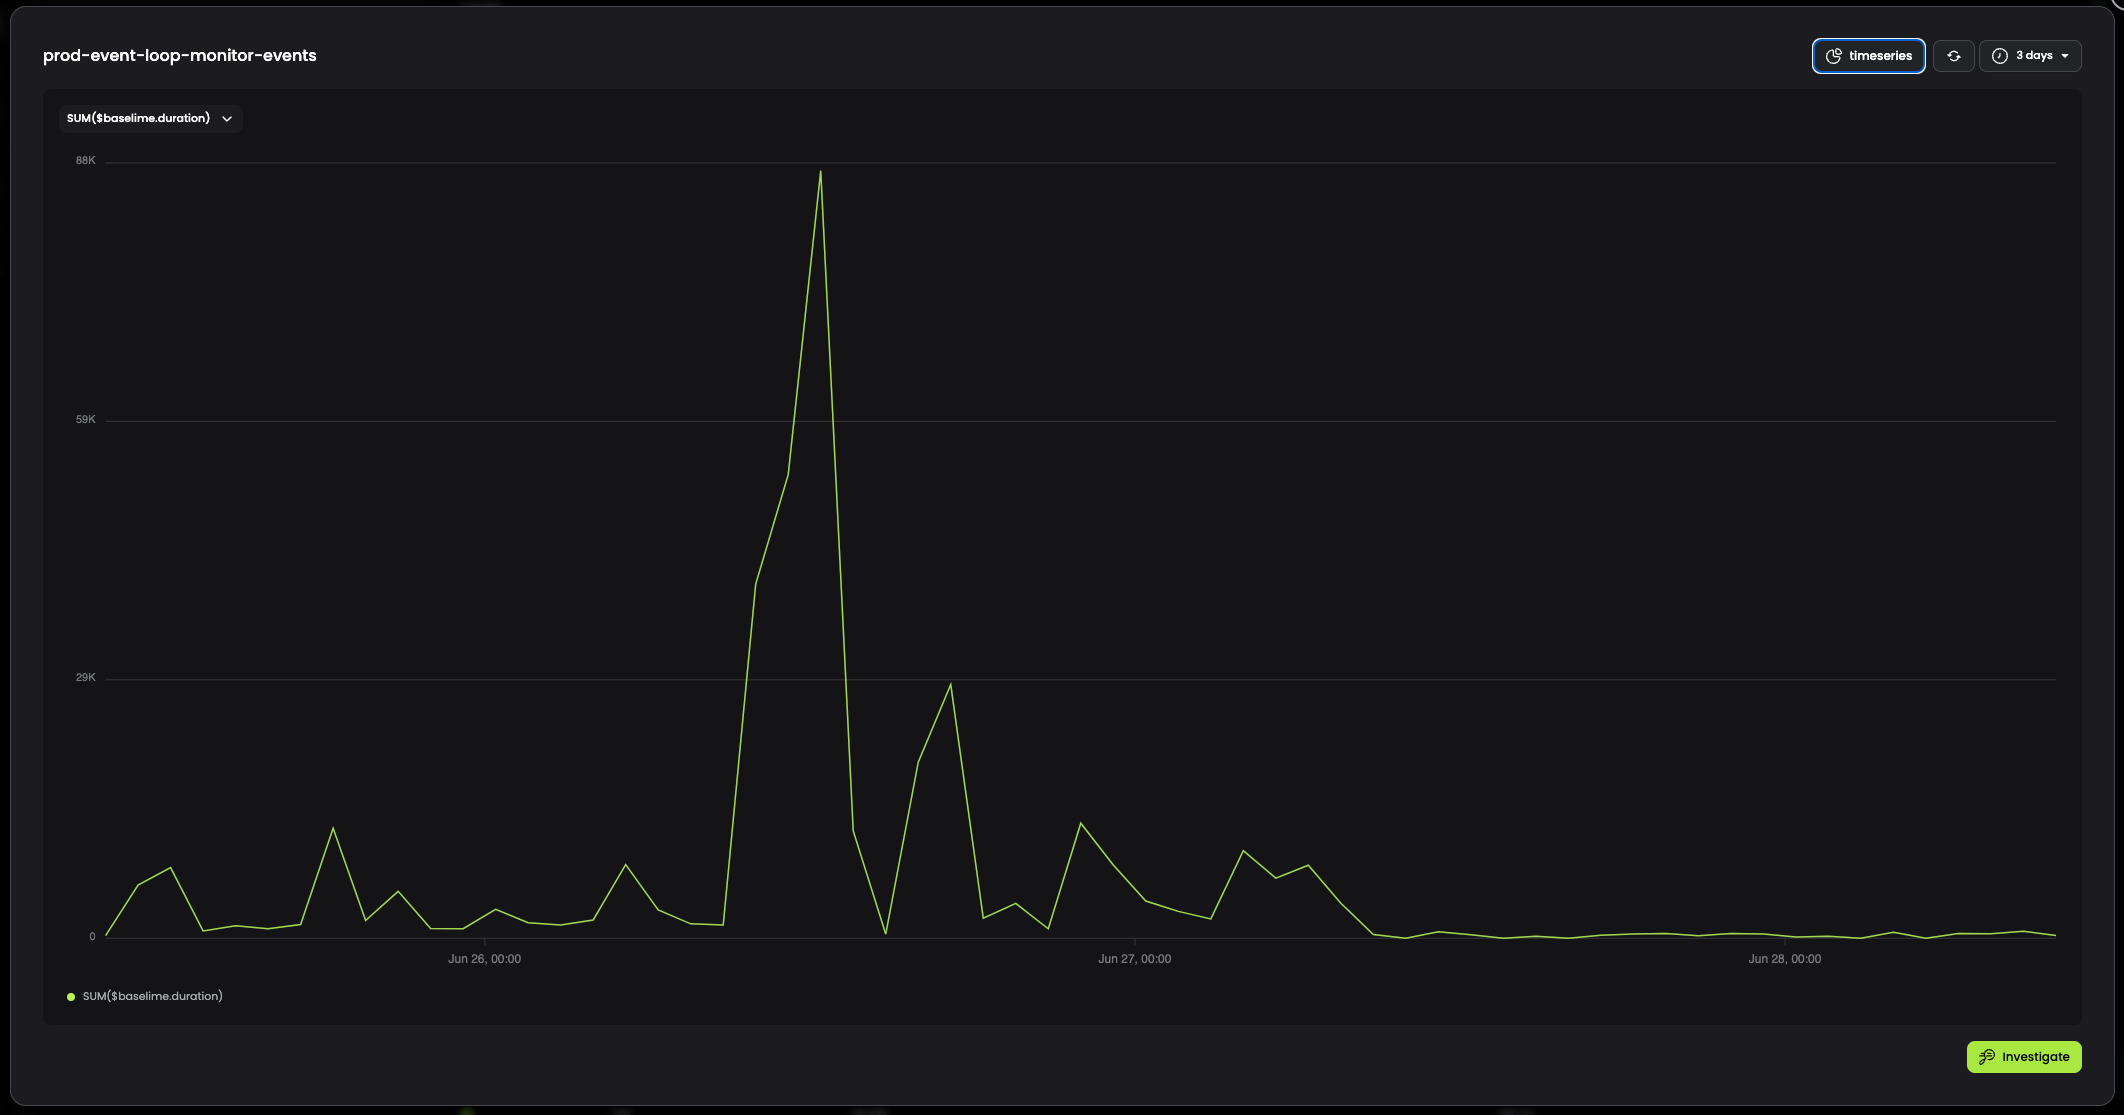
We now have alerts setup to notify us if any event loop lag over 1s is detected, so we're able to catch and fix any new issues that arise.
Next steps and takeaways
While most of the event-loop lag issues have been fixed, we still have more work to do in this area, especially around payload and output sizes of tasks in v3. We already support much larger payloads and outputs in v3 as we don't store payloads/outputs larger than 512KB in the database, but instead we store them in an object store (Cloudflare R2).
But v3 payloads are still parsed in our main thread, but in an upcoming update we're going to be doing 2 things to help with this:
- For tasks triggered inside other tasks, we're going to upload large payloads to the object store and pass a reference to the payload when triggering the task. This will allow us to avoid parsing the payload in the main thread in our service.
- For tasks triggered from client servers, and full payloads are being sent in the request body, we're going to stream the payload to the object store using
stream-json(we have already built a prototype of this working).
More importantly, we now have a much better understanding of what it takes to run a reliable Node.js service in production that can handle a large number of clients. Going forward, we're going to be more careful in designing our code to avoid event loop lag.
Addendum: serverless and event loop lag
Trigger.dev is implemented as a long-lived Node.js process, which as you can see above, takes some additional work to ensure that a single client can't block the event loop for everyone else. This is a common issue with long-lived Node.js processes, and is one of the reasons why serverless is so popular.
But serverless isn't a silver bullet. While serverless functions are short-lived, they still run on a single thread, and can still run into event loop lag. This is especially true if you're using a serverless function to handle a large number of clients, or if you're doing a lot of synchronous work in your function.
To keep request latency low, function instances are kept warm for a period of time after they're booted (known as a cold-boot). This means that while this event loop lag issue is mitigated somewhat by having many more instances running, it's still something you need to be aware of when building serverless Node.js applications. You can read more about this issue here.
Background jobs
If you are running a long-lived Node.js service, requests aren't the only source of event loop lag that you need to be aware of. Offloading long-running or queued tasks inside the same Node.js process can also cause event loop lag, which will slow down requests and cause issues like the ones we experienced.
This is one reason why the pattern of using serverless for background jobs is so popular. By running background jobs in a separate process, you can avoid event loop lag issues in your main service and scale up and down to handle changing workloads. And serverless can be a great fit, but still requires careful design to avoid event loop lag and timeouts.
Trigger.dev v3 is now in Developer Preview and takes an approach that combines the best of both worlds. We deploy and run your background task code in a separate process, completely isolated from your main service and from each other, without worrying about timeouts. If you'd like to try it out, please sign up for the waitlist.

