
This is a progress update all about the new metrics dashboard for Trigger.dev.
We're working on two things in parallel to bring the new metrics dashboard together. Firstly, a lot of the current dashboard data is being moved to ClickHouse to allow us to make the dashboard a lot more performant. Secondly, we're building out the new metrics dashboard itself using Recharts.
Here are some details on the interactivity we're building into the new charts:
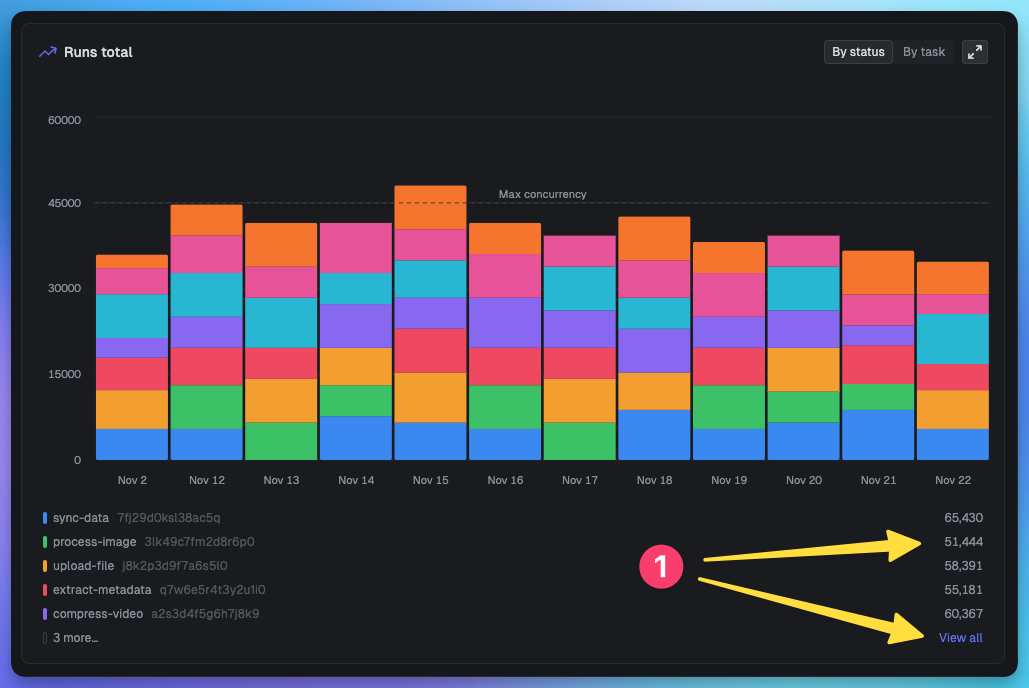
- Rather than overlay a tooltip on the chart, we're going to show a fixed number of legend items below the chart with the total values for the whole chart.
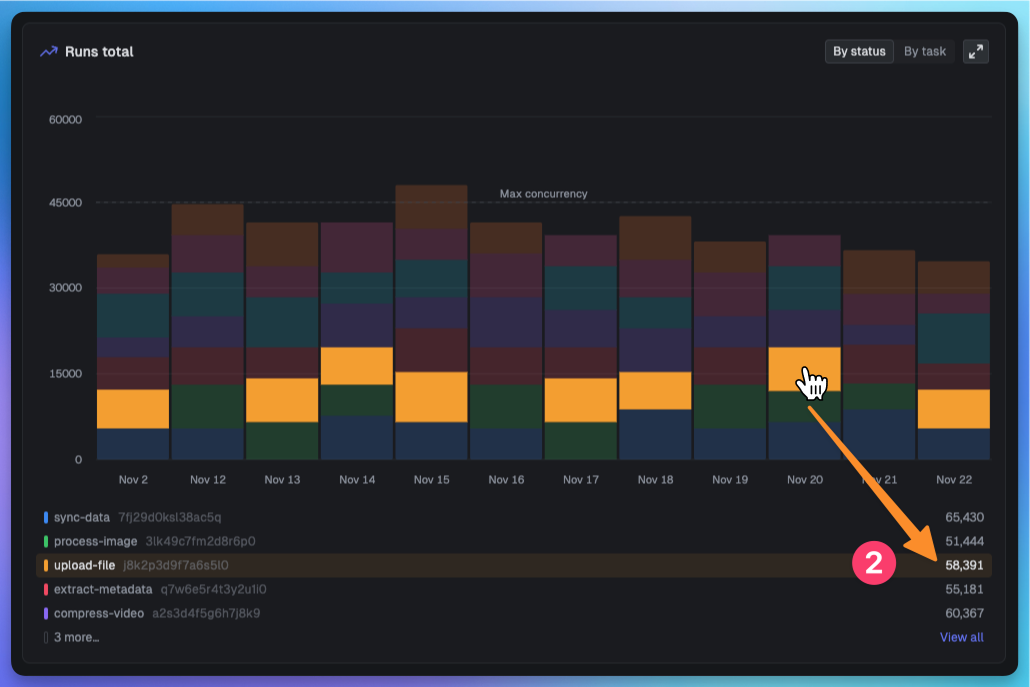
- If you hover over the legend items, we display the totals for that hovered item.
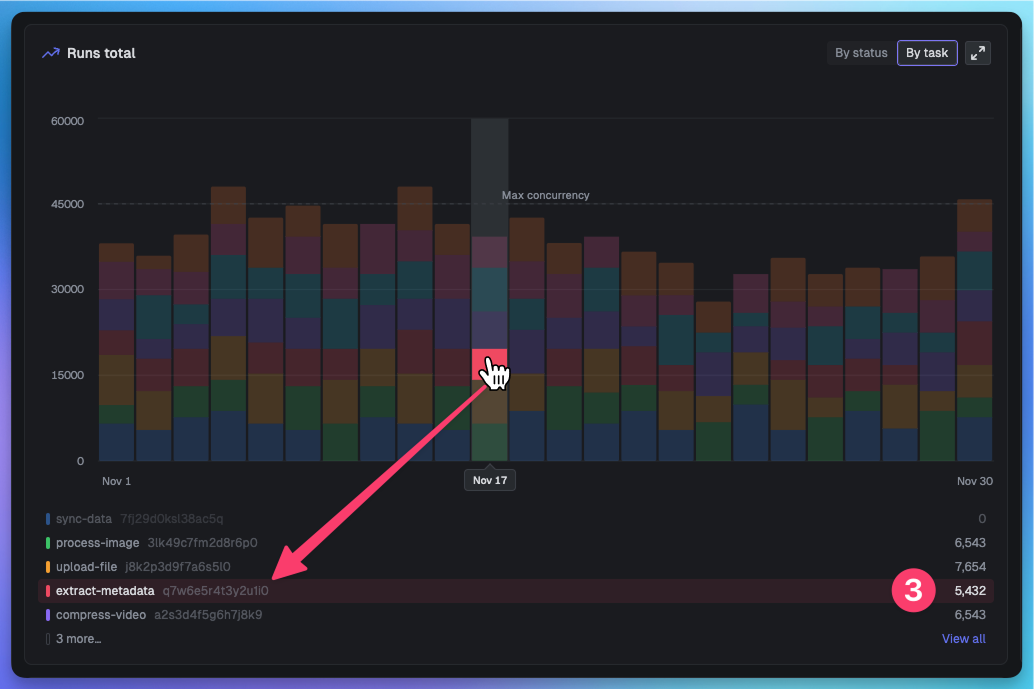
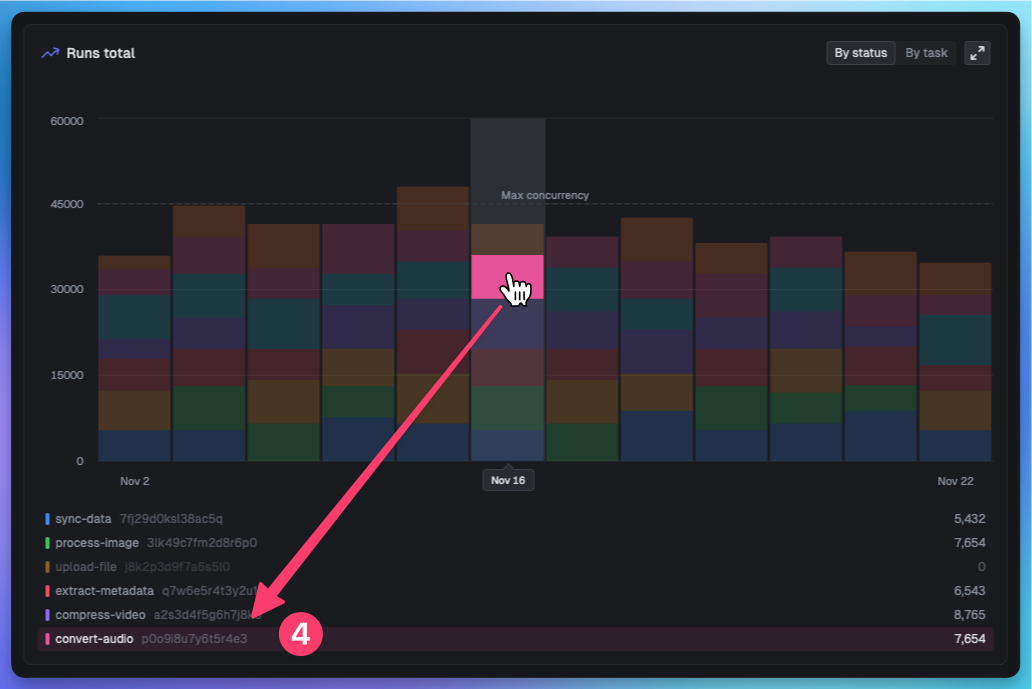
- If you hover over a single bar, we show just that bar's value in the legend.
- If you hover over a bar that's hidden from the legend, we temporarily display it as the last entry.
Finally, we've repurposed the Recharts tooltip for some other things…
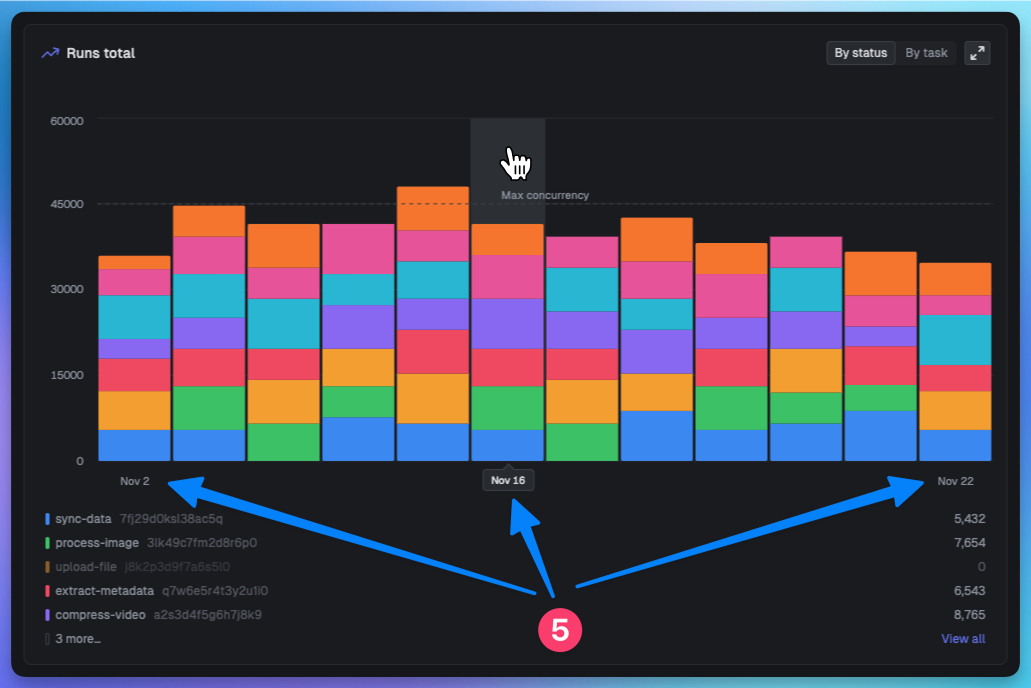
- On hover, we show the date in a tooltip and hide all other dates except the first and last to keep the chart clean.
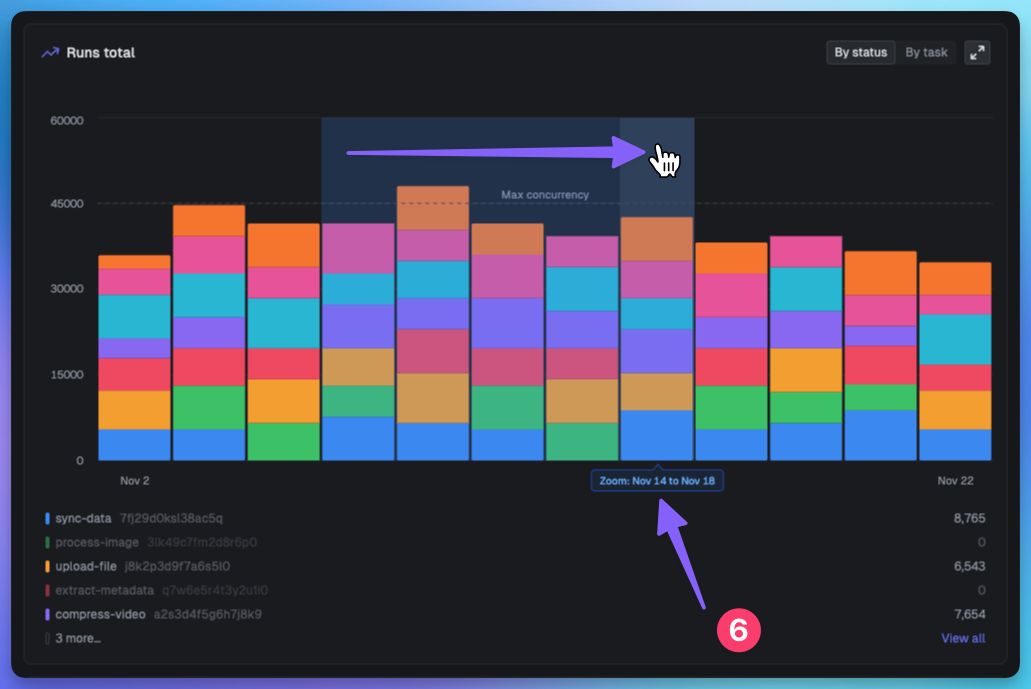
- You can drag the chart to zoom and the tooltip displays the 'to' and 'from' dates.