Before we get into what has happened over the past couple of days, I want to emphasize how important reliability is to us. This has fallen very short of providing you all with a great experience and a reliable service.
The volume of runs we're processing has increased very quickly in the past month. That has caused some issues in the past few days which didn't occur during the beta or when we were operating v3.
The entire engineering team worked on resolving these issues.
If you are interested in scaling a fast growing service and dealing with difficult technical problems, you should join us. We are putting more engineering roles live next week.
Huge error outputs crashing the run engine
September 25th 2025
What was impacted?
- Dequeue times increased significantly for some runs.
- Some runs completed more slowly because the engine servers were overloaded. In some cases this meant they eventually became "stalled" which which causes an automatic re-attempt.
- A downstream impact of this was a small percentage of runs got into an inconsistent state where the queue state didn't match the run state. This happened for runs being dequeued when a crash occurred.
- A downstream impact was the replication of run data to ClickHouse got behind for a while. This data powers the Runs list in the dashboard and the
runs.list()API.
What caused this?
The Run Engine is the service that takes a run through the states from dequeuing to completion. It's an API written in Node.js that uses Postgres and Redis and is executed on long-running servers. It's dynamically scaled horizontally to meet demand.
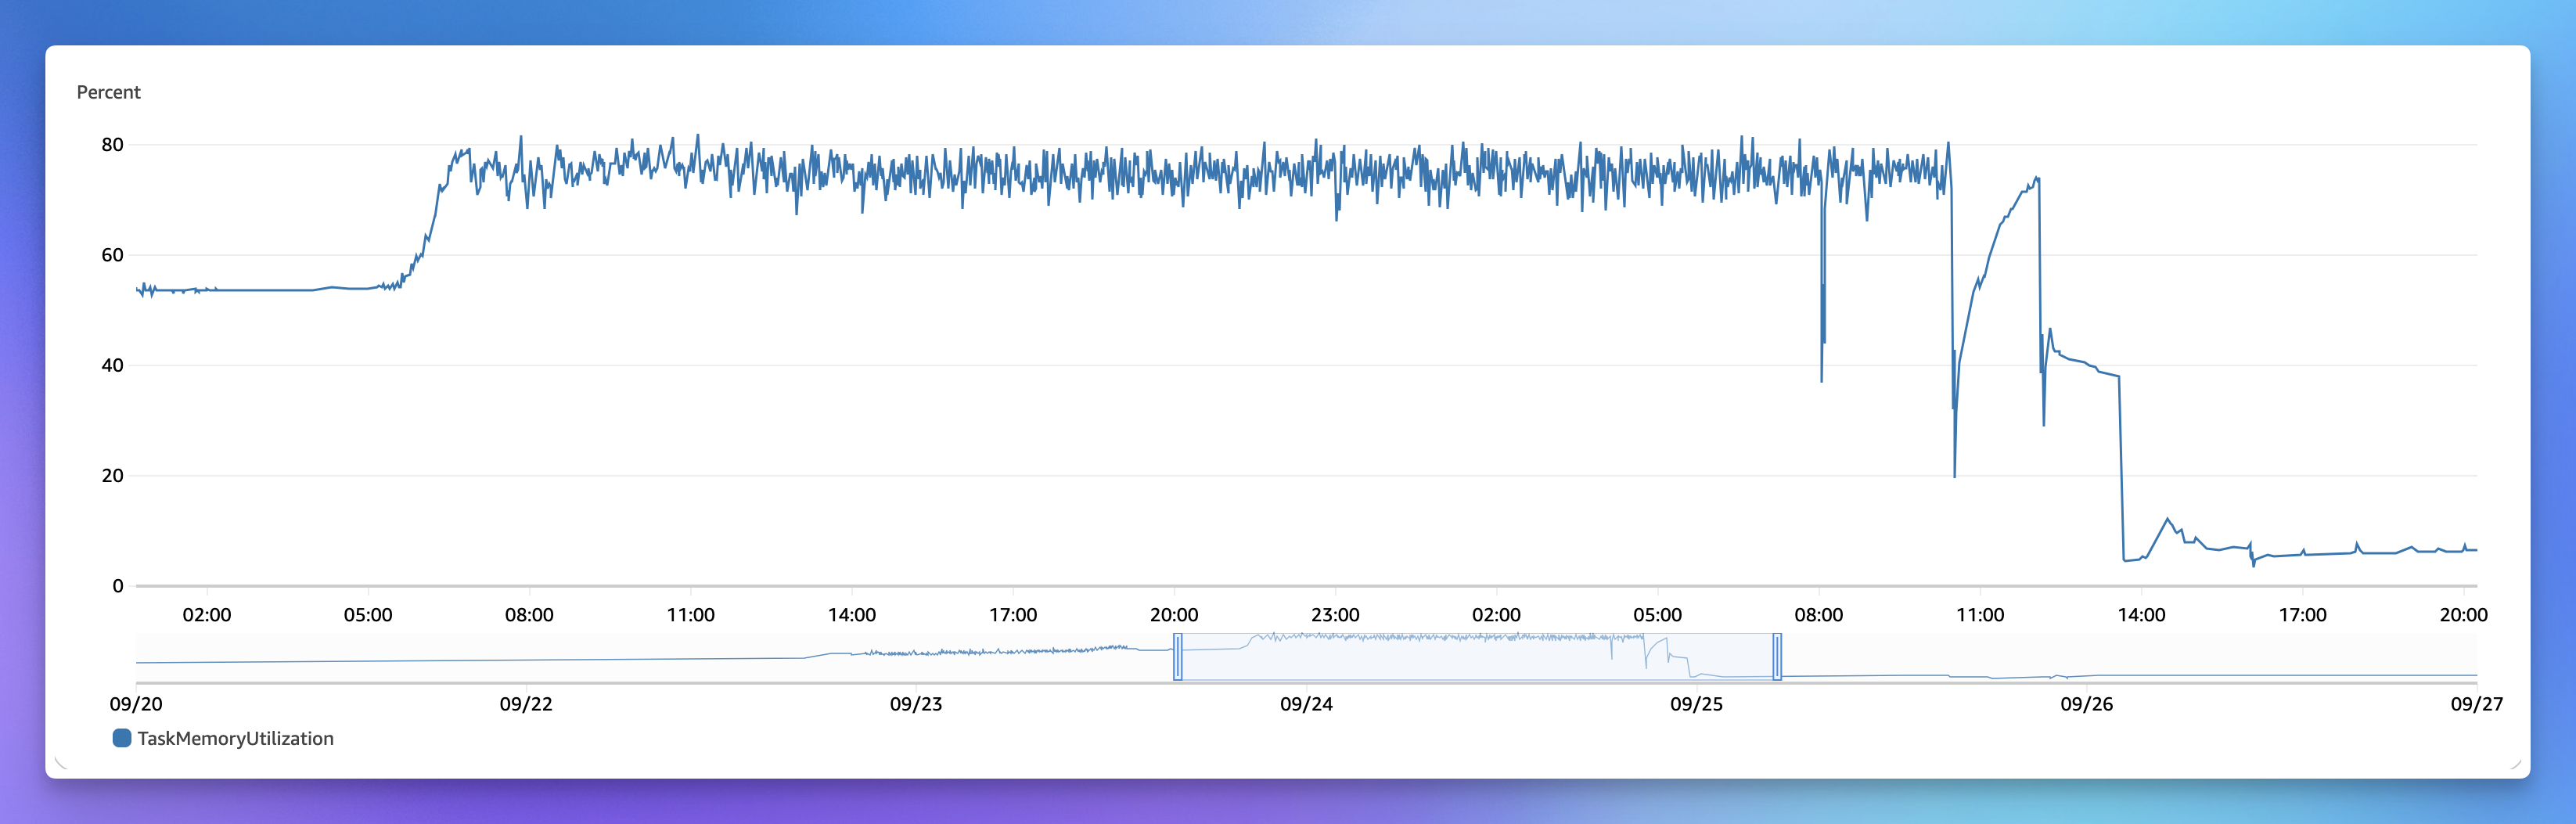
It's normally very rare for a Run Engine server to crash, they were steady at ~50% memory usage. On September 25th we started to see servers hitting 100% RAM, running out of memory, and crashing.
One of our customers had a bug in their code which meant they were suddenly throwing an extremely high volume of errors where the message and stacktrace were very large (over 1.4MB! each). When a run attempt fails the error gets serialized and sent to the engine where it gets stored in Postgres and the run will re-attempt (up to the user-defined maximum number of attempts).
For successful runs we offload large outputs to Object Storage (R2/S3) and only store a URL to the output. But we weren't doing this for errors.
When all of these child runs failed for the customer the batchTriggerAndWait() would continue the parent run and we would fetch all of the child run outputs. This resulted in 700MB of error data from Postgres for each batch. Prisma failed to pass this data from the rust engine to Node.js without running out of memory:
Invalid `prisma.taskRunExecutionSnapshot.findMany()` invocation:Failed to convert rust `String` into napi `string`
What we did to fix it
The root cause: large error outputs
Once we saw this new error spike it was fairly easy to identify the issue and fix it. We now trim error messages and stacktraces to 16kb each (which is plenty of error data for you to debug with).
Since making this change the memory usage for the run engine is consistently at ~10%, far lower than the steady state before. This implies there were other largish errors before that this change has also helped with.
Inconsistent queue state
The Run Engine crashes caused some runs to be dequeued from Redis but not to be changed to the PENDING_EXECUTING state in Postgres. This meant that these runs weren't picked up for execution and didn't start. Plus they weren't in the queue anymore, so they were stuck.
We've created a new queue monitor tool that can detect inconsistency and can requeue runs and fix concurrency limits. This is being used manually in production now and is working. It needs to be rolled out to be fully automated.
We're also looking into how to harden the process to prevent the inconsistency in the first place.
Replication of run data to ClickHouse
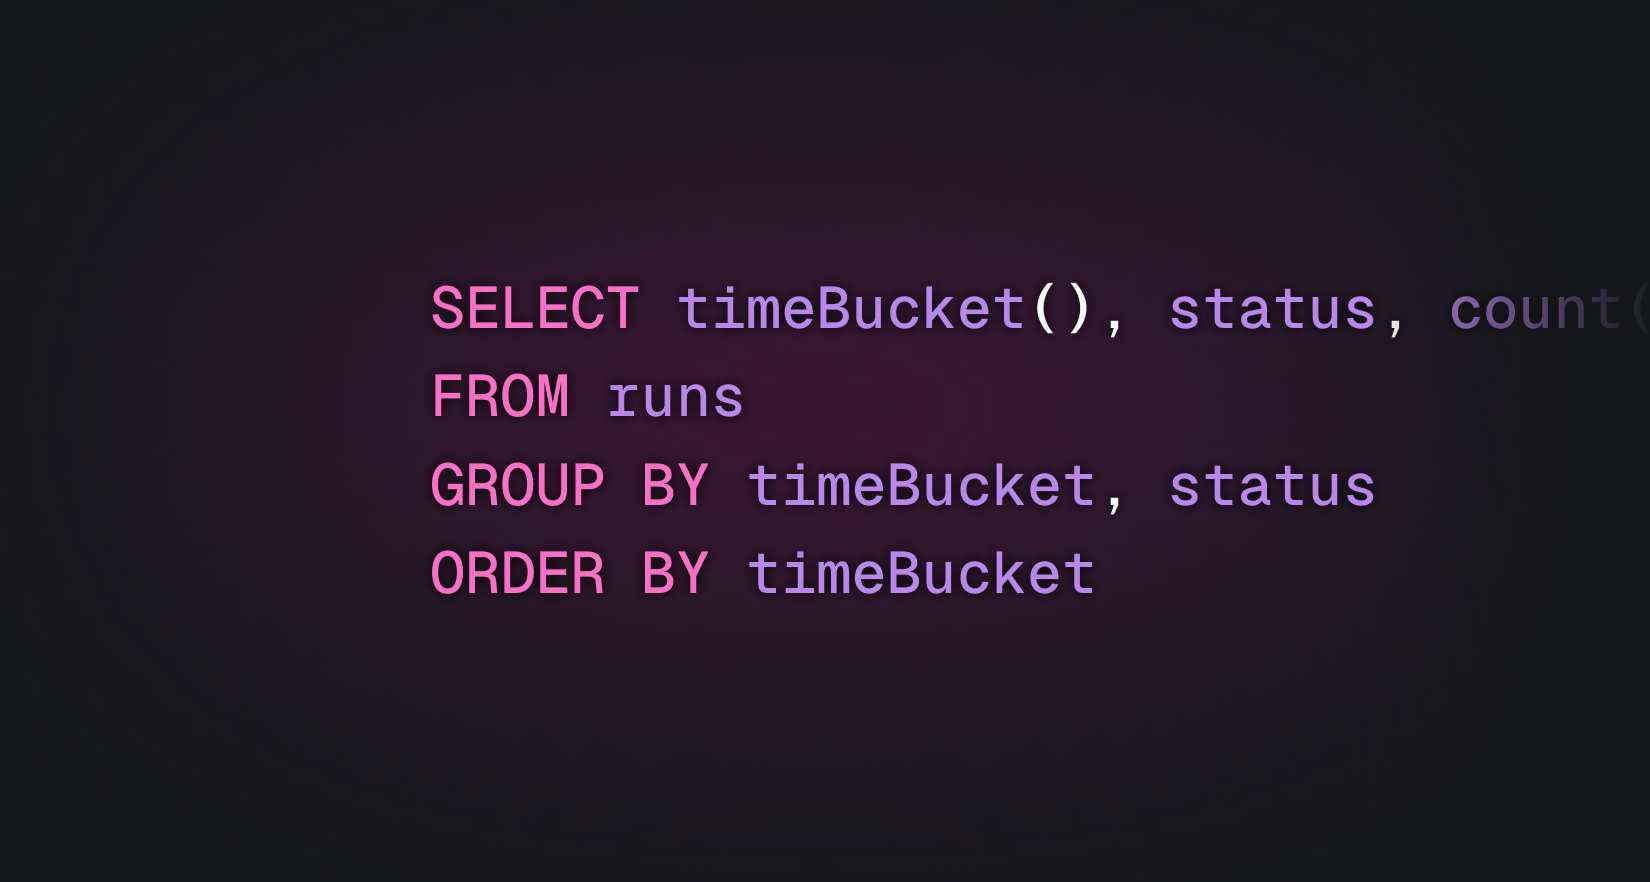
The Run Engine crashes meant that we built up runs that needed to be processed. That meant that we were then processing far more runs than normal. The downstream impact was that we needed to replicate far more runs to ClickHouse, which is used for the Runs list in the dashboard and the runs.list() API.
We don't currently shard this replication, but will do in the future.
The performance was bottlenecked by Node.js eventloop lag.
Node.js only has a small amount of threads of operation, with the event-loop belonging to the main thread. That means that for every request that comes in, it's processed in the main thread.
This allows Node.js services to run with much more limited memory and resource consumption, as long as the work being done on the main thread by each client is small.
When you're doing lots of synchronous CPU work you can cause this to happen. In our case we're processing a lot of data.
For now, we have reduced eventloop lag by reducing the amount of logs we emit… yes that's right. We were emitting a ton of useless logs and this can have a significant impact on performance.
Here's an interesting tweet with more detail. There are some good Node.js tips in the replies.
Queue sharding issues
September 25–26th 2025
What was impacted?
Some runs were slower to dequeue than normal.
What caused this?
The Run Queue is built on top of Redis. It's separate into two stages:
- A concurrency limiter – this prevents you exceeding your account or user-defined concurrency limits.
- The FIFO queue – runs are pulled as fast as possible from this by the appropriate region.
To ensure rapid processing of millions of runs we shard the concurrency limiter and it's continually processed in the background. We have additional optimizations to ensure fast dequeuing when more concurrency is available or a new run is triggered.
This concurrency limiter stage is sharded so the Redis operations are fast, and we can horizontally scale the processing. These shards had always been fairly small, under a few hundred "queues" in each.
One of the shards had become far larger than the others because many of the queues were at their concurrency limit and we had limits on how many Redis keys were being read. The combination of this limit and the larger shard meant that some queues weren't being evaluated.
What we did to fix it
We've increased both the number of shards and the number of Redis keys that are read at once. We will need to continually monitor this and keep re-sharding as we scale.
us-east-1 dequeue issues caused by etcd
September 26th 2025
What was impacted?
Runs in us-east-1 were impacted.
- New cold start runs couldn't start because etcd was overloaded and went into read-only mode.
- Only warm starts were working when etcd was in read-only mode - runs that could reuse existing pods.
What caused this?
This issue started in our us-east-1 region when the Kubernetes cluster etcd database filled up with 60-70,000 entries. Our service that cleans up old pods couldn't delete these pods fast enough to keep up.
The etcd database is what Kubernetes uses to store information about all the pods and services in the cluster. When it gets too full, it goes into read-only mode to protect itself. This meant no new pods could be scheduled, so new cold start runs couldn't start.
Warm starts were still working because they reuse existing pods. The majority of runs are warm starts usually, which means there's no pods that need to be cleaned up.
If there's a new deploy from a customer the old pods will be cleaned up when the runs are finished, because the versions don't match. This can result in a spike in churn. We think an unusual number of runs and deploys for our larger customers happened at the same time, resulting in a spike in pods that needed to be cleaned up.
Timeline
September 26th 2025
- 2:45 AM UTC: A small percentage of runs got dequeued but failed to successfully start in
us-east-1. - 3:57 AM UTC: Our incident alarm went off. At this point more runs were failing to start.
- 4:24 AM UTC: We diagnosed the issue was etcd being in read-only mode so pods weren't being scheduled.
- 4:26 AM UTC: We changed cleanup settings to try and clean pods faster. Configuration changes took a while to roll out.
- 4:32 AM UTC: We manually started cleaning pods in batches, to try and get etcd out of read-only mode.
- 4:41 AM UTC: We removed the etcd alarms which is required to get etcd out of read-only mode.
- 5:03 AM UTC: The issue was fully resolved.
What we did to fix it
- Manually delete pods in batches, to unblock etcd.
- Removed etcd alarms to get it out of read-only mode
- Increased the normal deletion rate from 500 pods every 10 seconds.
The etcd restart took longer than expected on AWS, which slowed down our recovery.
What we're doing to prevent this happening again
Better alarms
First we need better early detection of an issue where runs aren't getting started successfully after dequeuing. It shouldn't have taken an hour from the first pods failing to be started to an alarm going off.
Our existing alarm failed to detect this because it was a run that executes every minute in the cluster and so was warm starting. As warm starts weren't impacted, an alarm wasn't triggered.
We are doing two things:
- Make sure the existing run alarm doesn't use warm starts.
- Add a new Cloudwatch alarm that triggers when an unusual number of runs "stall" between dequeuing and starting. The logs for this event clearly show the early symptoms of the issue and this alarm will be sensitive to it.
Underlying root cause
The root cause was that etcd filled with pods and then put itself into read-only mode. We've improved the rate that we clean up pods in the cluster and are closely monitoring this to see what else we can do.
Longer warm start period
This isn't a fix for the issue, but it does reduce load on the cluster and make your runs start faster.
When a run finishes we keep the run alive, waiting to see if there's another run that can be executed on the same machine. Before last week we waited for 1 minute, now we wait for 2 minutes.
This will improve start times when you're doing relatively frequent runs.
Longer term
We are going to move away from one pod = one run in the future when we start using MicroVMs for execution. This will reduce the reliance on Kubernetes and etcd for high throughput.
Reliability is never finished, so work continues to make sure this doesn't happen again.